Florent Boudoire,a,c,* Rita Toth,a Jakob Heier,b Artur Braun,a and Edwin Constablec
*florent.boudoire@empa.ch
aLaboratory for High Performance Ceramics
Empa, Swiss Federal Laboratories for Materials Science and Technology
Überlandstr. 129, CH-8600, Dübendorf, Switzerland.
bLaboratory for Functional Polymers
Empa, Swiss Federal Laboratories for Materials Science and Technology
Überlandstr. 129, CH-8600, Dübendorf, Switzerland.
cDepartment of Chemistry
University of Basel
Spitalstr. 51, CH-4056 Basel, Switzerland.
Metal oxide thin films based on nanopillar array have been suggested as efficient photoanode systems for solar water splitting and hydrogen fuel generation in photo-electrochemical cells1.Iron oxides such as α-Fe2O3 (hematite) are low-cost, environmentally benign and abundant semiconductors for use as such photoanodes. But hematite has the major disadvantage that its optical thickness is large (118 nm at λ=550 nm)2 compared to its charge carrier recombination length (2-4 nm)3. To overcome this drawback, various approaches for micro- or nano-structuring of iron oxide into nanopillar, nanorod and nanotube arrays, for example by aqueous chemical growth4 or anodization5,6 have been investigated.
Here we present a novel and simple method of obtaining iron oxide structures, taking advantage of the self-organisation occurring in molten polymers subjected to an external electric field. This phenomenon is known as electrohydrodynamic destabilization (EHD) and has been previously used to tailor micrometric droplets or pillar arrays7,8. The polymer structures obtained by Heier et al.9, with spatially modulated electric fields, show that the sizes and aspect ratios obtained can be controlled using parameters such as the electric field strength and the lateral field modulation. The control provided by such heterogeneous electric fields has been exploited by Schäffer et al.10 to achieve features with lateral dimensions down to 140 nm using a structured electrode. Moreover this electrolithographic phenomenon is a determining factor in the upscaling of the destabilized region11. The use of this technique to oxide films has been initiated by Voicu et al.12. They destabilized titanium alkoxide-alcohol solutions and obtained micrometric TiO2 patterns. To the best of our knowledge no other attempt has been made to use EHD to structure inorganic materials. Our study focuses on the development of electrohydrodynamic destabilization for the high-fidelity conversion of polymer/iron salt structures obtained by EHD destabilization into hematite (α-Fe2O3) structures. The strategy adopted is to encapsulate an iron salt in a polymer thin film and then tailor the polymer structure using EHD. After structuring, the film is pyrolysed at 500°C in an air vented furnace to decompose the polymer matrix, whilst at the same time converting the iron to hematite.
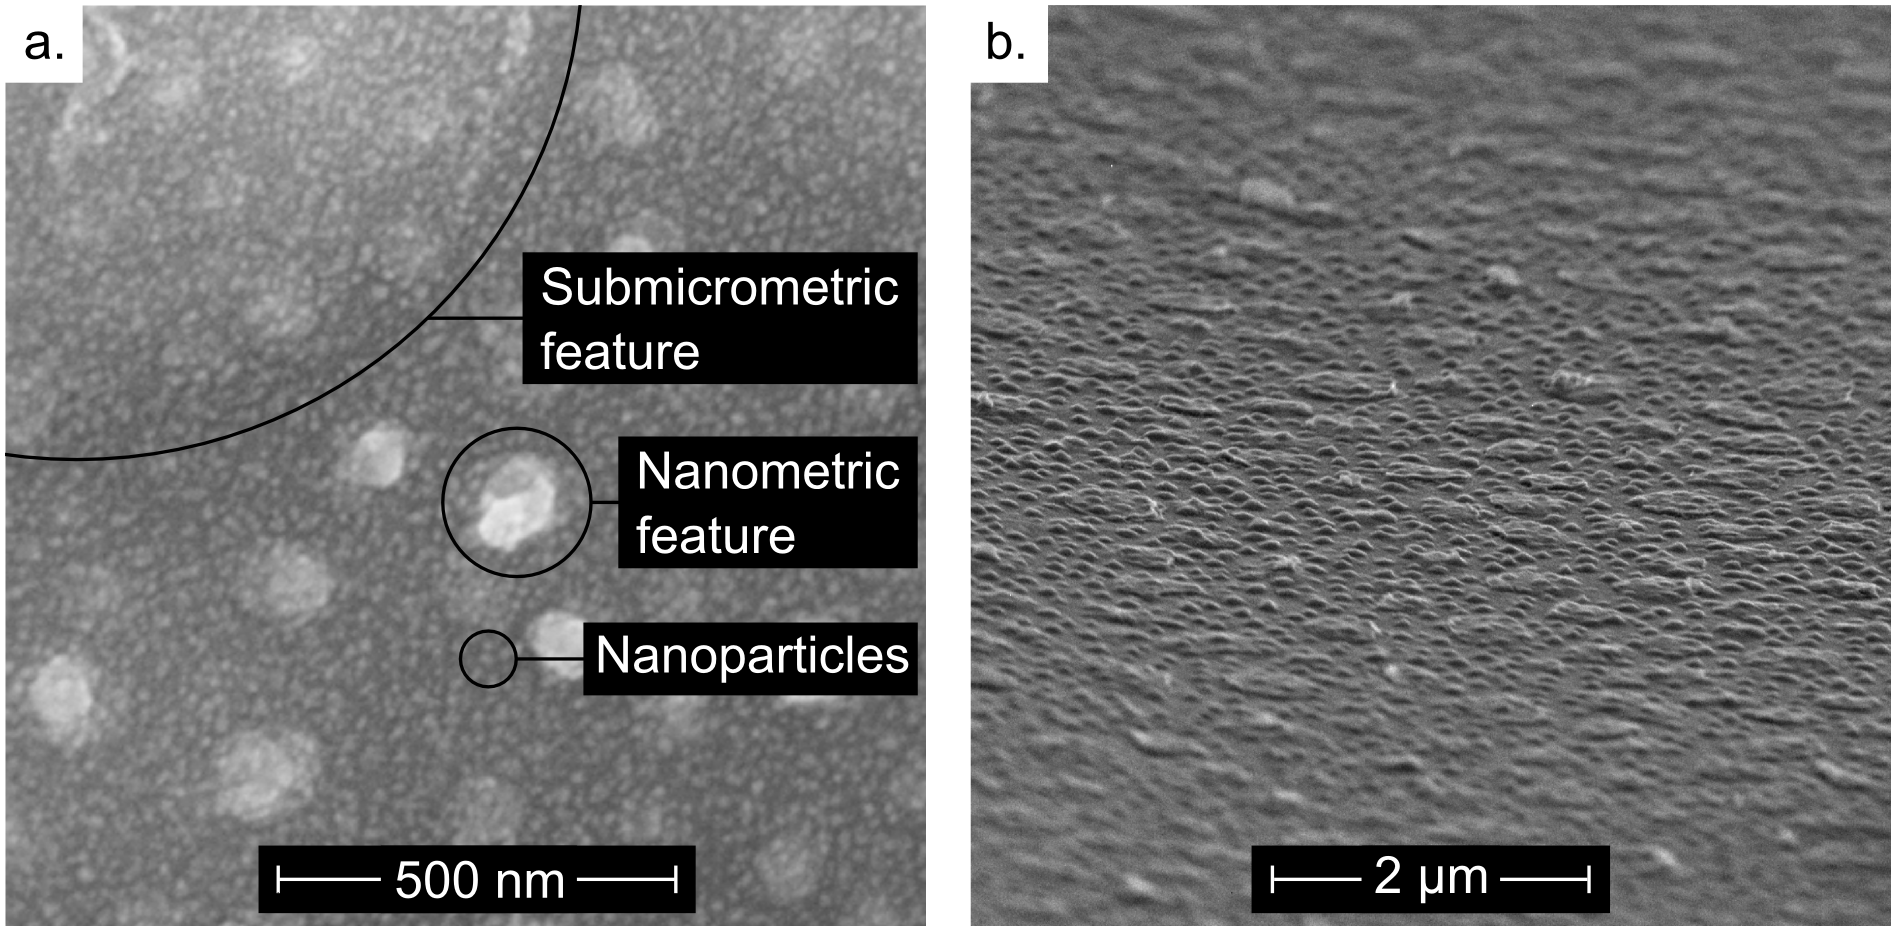
The thin film for destabilization was spin-coated from an aqueous solution on a silicon wafer. This solution was prepared by mixing 0.5M in pyridyl groups of poly(4-vinylpyridine) (P4VP) (Mw ≈ 60,000, Sigma Aldrich) and 0.5M of FeCl3 (reagent grade, 97% anhydrous, Sigma Aldrich) in double deionized water, leading to a 1:1 molar ratio between pyridyl groups and aqueous iron chloride. The resulting aqueous solution is acidic with a pH of 1.5. The spin coating was realized using a Primus STT15 spin-coater from ATMvision AG, with a holding time of 60 seconds at a spinning speed of 6000 rpm which was reached within 2 seconds. After spin-coating, the thin film was air-dried at room temperature for at least 2 days. The resulting film has a thickness of 180-200 nm (profilometer), and is flat with only nanometer scale roughness (Fig. 1 a.).
This film was then melted under an electric field, facing a nanostructured aluminium electrode (Fig. 1 b. and c.). The nanostructured electrode acts as a master electrode and controls the size of the features developing at the surface of the polymer film. Since the present study is focused on controlling the size of the hematite structures, no attempts has been made to use a master electrode possessing an organized pattern as in the study of Voicu et al.12. The electrode nanostructure is obtained by evaporating aluminium in vacuum onto a silicon substrate. Aluminum evaporation pellets, 99.9996% pure, were thermally evaporated using a Univex 300 thermal evaporator from Oerlikon Leybold Vacuum. Arslan et al.13 showed that vapour phase aluminium deposited on a silicon oxide surface followed with high fidelity the droplet deposition and coalescence model described by Family and Meakin14 and obtained aluminium islands of nanometric dimensions after less than 2 minutes deposition. In the present study, the master electrode contains ten times larger droplets than the clusters obtained by Arslan. Since the droplet growth follows the Family and Meakin model, this difference is accounted for the longer deposition time (15-20 minutes), leading to more material coalescence and therefore larger features.
An air gap of less than 140-160 nm separated the polymer film surface and the master electrode. In order to maintain this submicrometric gap, SU8-2000 photoresist was spin coated, developed and etched on the master electrode surface to obtain a spacer. The wafers were then contacted and pressed together (see Supporting Information / Details of the setup used for the electrohydrodynamic destabilization). The entire assembly was placed in an oven for 3 hours at 180°C and 0.01 mbar vacuum with a bias of 50 V applied to the wafers.The heating temperature of 180°C was chosen to melt the P4VP film, which has a glass transition temperature in the range 140-150°C15,16. After heating, the assembly was cooled to room temperature while maintaining the 50 Volt bias. After destabilization the films were heated in an air vented furnace at 500°C for 2 hours, using a heating ramp of 5°C.min-1.
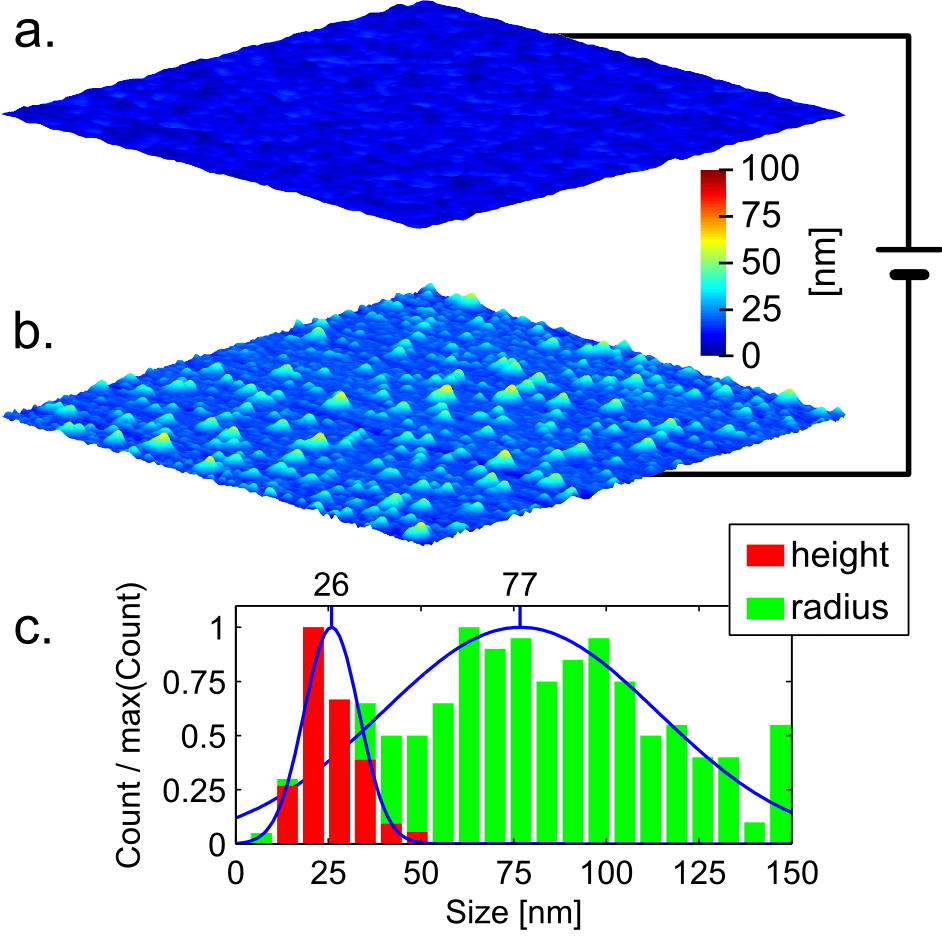
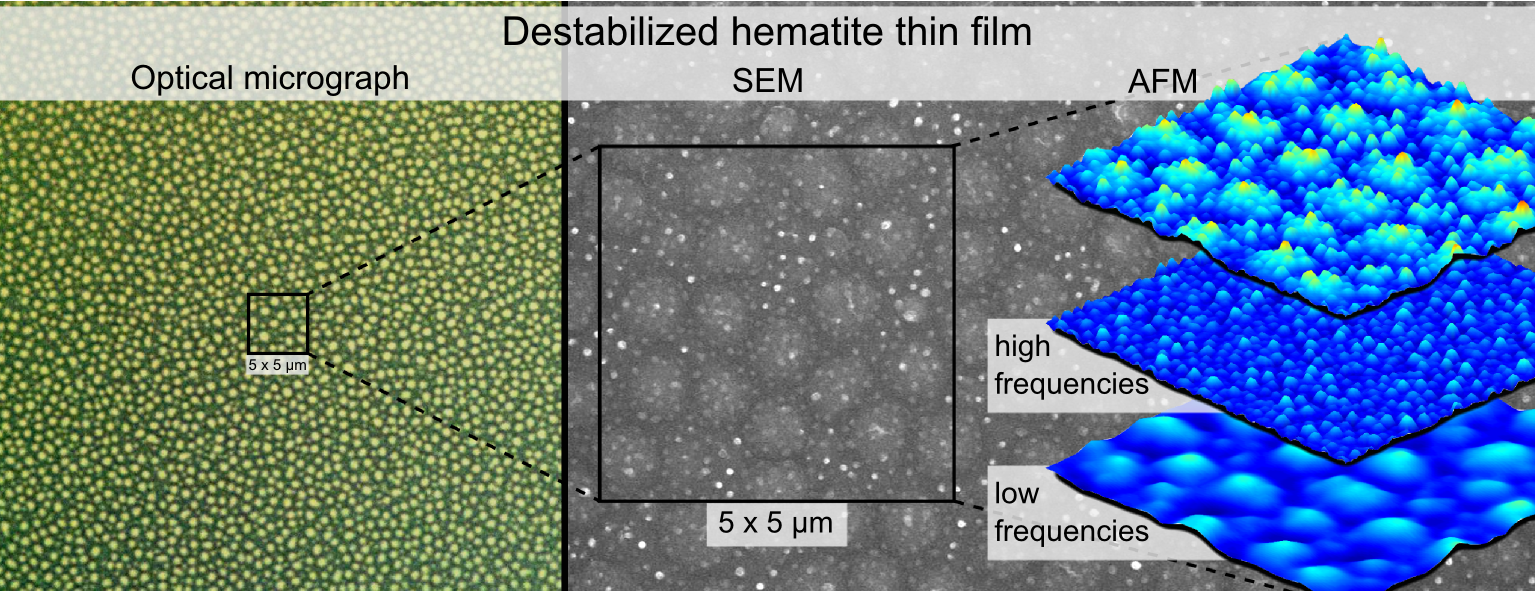
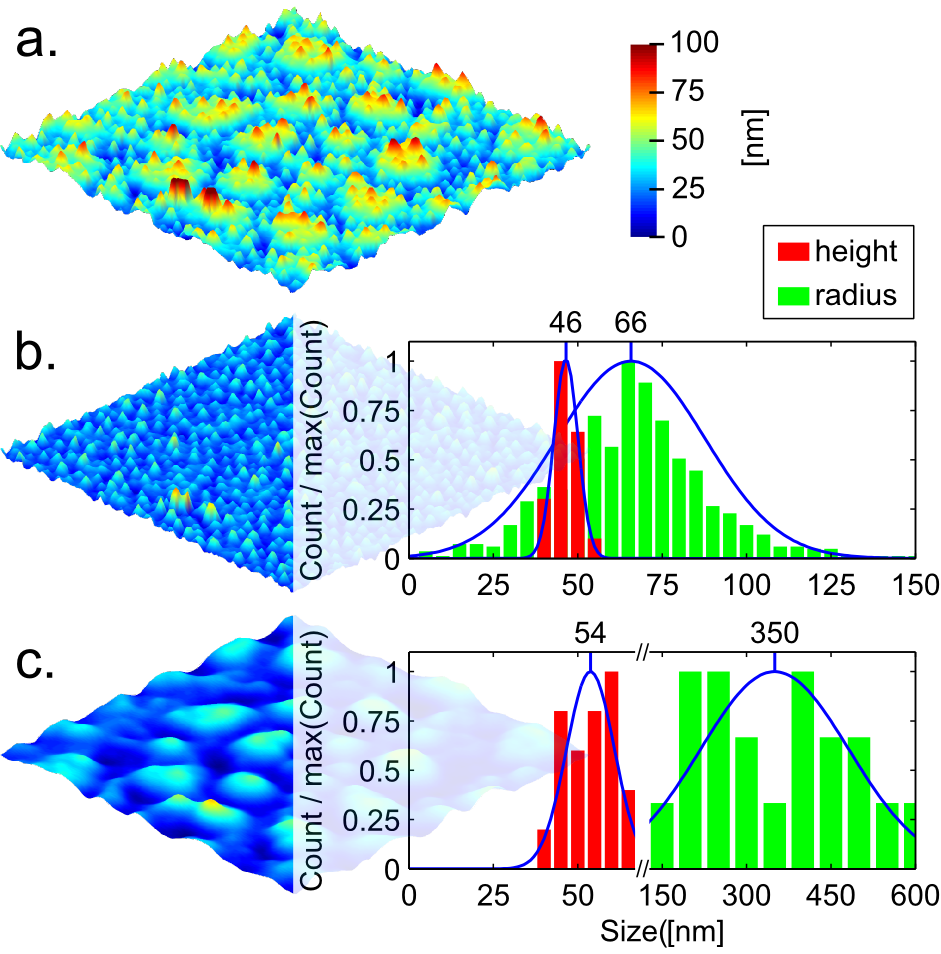
The destabilization of the P4VP/FeCl3 thin film results in the formation of two different kinds of features: oblate droplets with sub-micrometer size, and droplets with nanometer size (Fig. 2 a.). Using complementary Matlab and Fiji procedures (see Supporting Information/Matlab-Fiji code for image processing) the nanometric distribution has been mathematically separated from the submicrometric distribution by using a high pass filter (Fig. 2 and 3). The size distribution of the nanometric features (Fig. 2 b.) and of the master electrode (Fig. 1 c.) match quantitatively. Therefore, the nanometric droplets observed on the thin film surface most likely originate from heterogeneities in the electric field9. Where a feature of the master electrode is present the air gap is smaller, leading to a local enhancement of the electric field in the film. The electrostatically induced pressure is higher on the melted film surface in the regions facing a feature of the electrode, and the film surface replicates the electrode features. Since the mean height of the master electrode features is 26 nm and the air gap is in the 140-160 nm range, the increase in electrostatic pressure where a feature of the master electrode is present is in the range of 12 to 14%. In contrast, the sub-micrometric droplets originate from the average electric field. Indeed their order of magnitude matches the typical micrometer scale features obtained using homogeneous electric field for thin polymer film destabilization7,8. Although larger homogeneous electric field leads to smaller features, the minimum size that these features can reach is limited by viscous effects17.
To convert this polymeric structure into an oxide, the film was pyrolysed at 500°C in air. This thermal oxidative treatment allows precipitation and pyrolysis of iron oxide inside the film, whilst simultaneously decomposing the polymer matrix. The film features are well preserved after pyrolysis (Fig. 3). Their shrinkage is not homogeneous; the radius distribution is almost invariant, while the height distribution significantly decreases. The calculated shrinkage for the submicrometric and nanometric height distributions are 32% and 36% respectively.
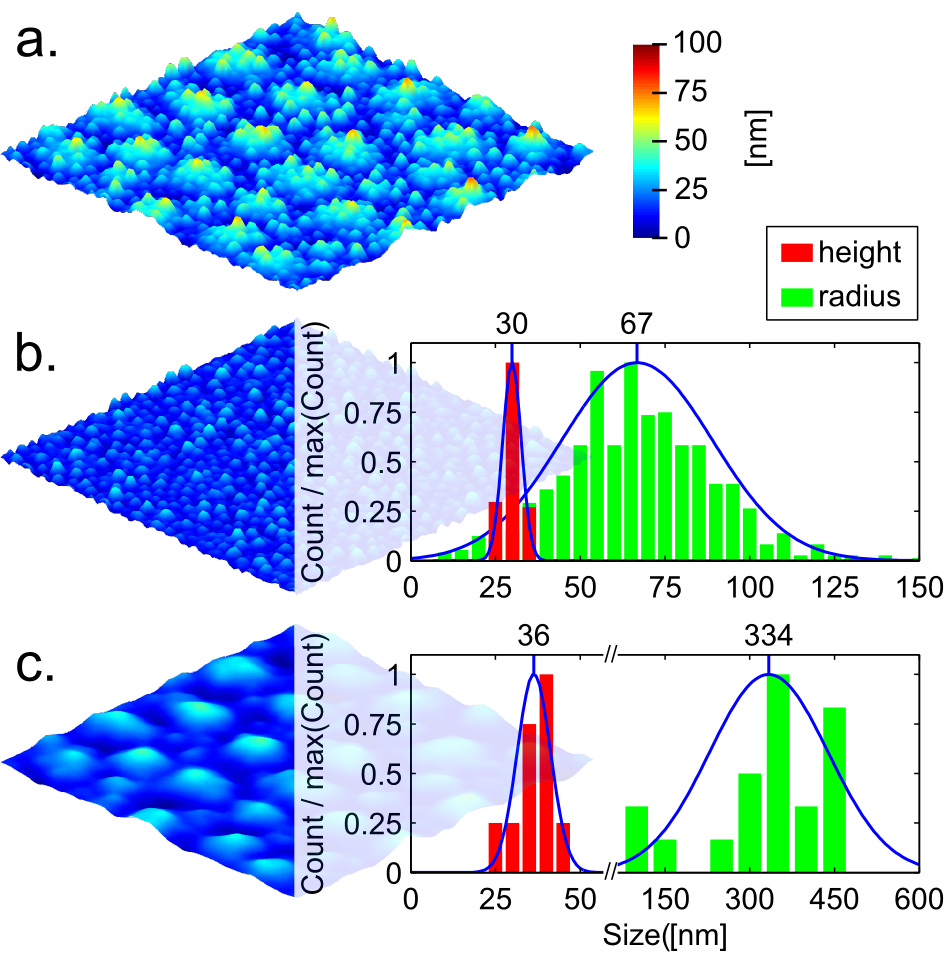
The resultant film consists of a homogeneously distributed structure of nanometric particles, around 30 nm in diameter (Fig. 4) and we propose that the iron chloride is homogeneously distributed within the pristine P4VP/FeCl3 thin film and evolves into nanoparticles during the pyrolysis. The homogeneous nanoparticle precipitation in the bulk of the polymer accounts for the low shrinkage of the features.
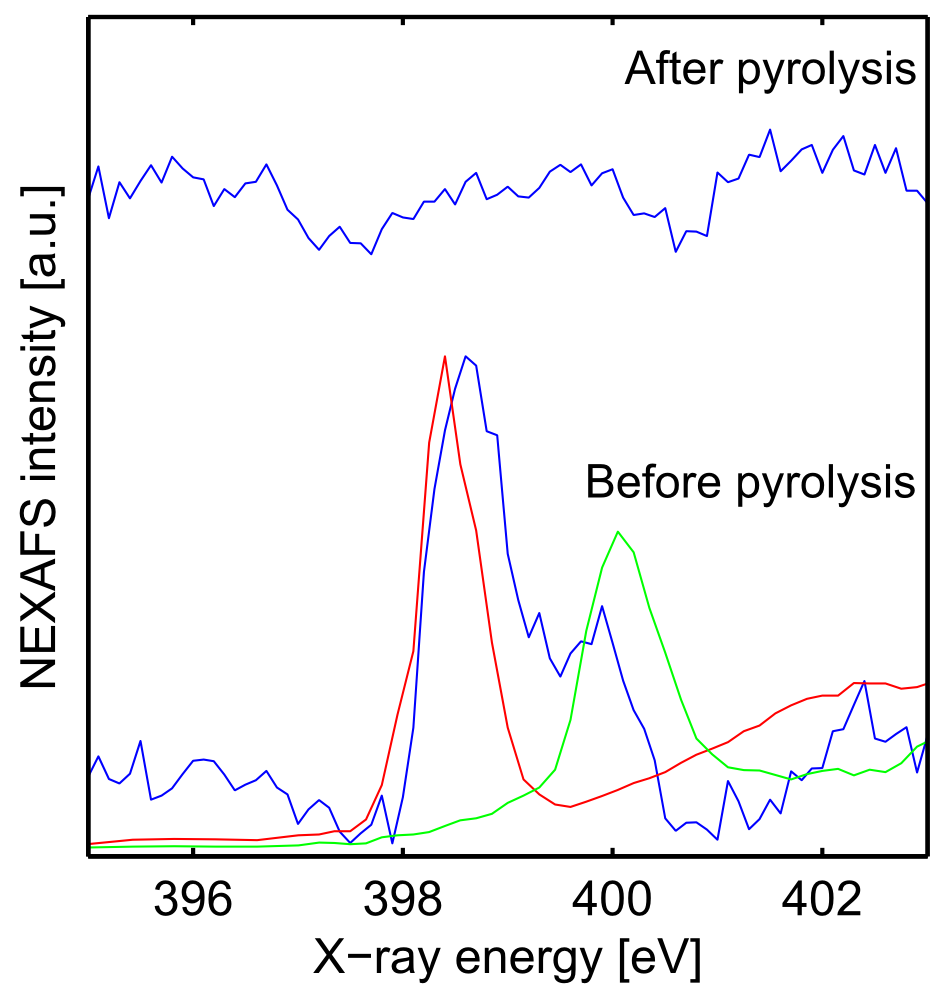
In order to analyse the molecular structure of the thin film before and after pyrolysis (on 5 × 5 mm silicon wafers), near edge X-ray absorption fine structure (NEXAFS) spectroscopy measurements have been carried out at the experimental station SurICat, Optics beamline at BESSY-II, Helmholtz Zentrum Berlin. NEXAFS spectra provide distinctive features that are characteristic of the structure and bonding environment of an atom18. The screened energies correspond to the nitrogen K-edge (395 eV to 403 eV), the oxygen K-edge (520 eV to 560 eV) and the iron L-edge (700 eV to 730 eV). Excitation at the nitrogen edge is expected to correspond to an excitation of the nitrogen from the pyridine groups of the polymer, and excitation at the iron and oxygen edges have been chosen in order to identify iron oxide phases. These NEXAFS spectra were recorded using the total electron yield technique, by measuring the current drain to ground normalized to the incident photon flux. The sampling depth in TEY measurements probes mostly the surface and sub-surface of the samples. The energy resolution is 66 meV at 400 eV. NEXAFS measurements at the nitrogen K-edge of samples prior to pyrolysis present two prominent spectral features at 398.6 eV and 400.0 eV (Fig. 5) corresponding to the transition from the 1s atomic nitrogen orbital to the π* molecular orbitals of the pyridine. The presence of two features prior to pyrolysis, with a shift of around 1.4 eV probably corresponds to partial protonation of the P4VP nitrogen. Fujii et al.17 recorded NEXAFS spectra at the nitrogen edge of both neutral and fully protonated P4VP and obtained peaks at 398.9 eV and 400.4 eV for the neutral form and protonated form respectively. The same shift of 1.5 eV between protonated and neutral nitrogen has also been observed in polyaniline samples by Hennig et al.19. The partial protonation of the polymer can be linked to the low pH (1.5) of the aqueous solution used for the spin coating of these films. This partial protonation could lead to the separation of the polymer into hydrophilic (protonated) and hydrophobic (neutral) regions and Millan et al.20,21 have studied P4VP/iron hydroxide nanocomposites proposing that hydrophilic regions encapsulate the iron ions. When the iron ions precipitate, this encapsulation allows the stabilization of iron nanoparticles within the bulk of the polymer. It should be noted that Millan et al. induced deprotonation of PVP compounds by addition of NaOH and observed deprotonation onset at pH = 3.020,. In our case no NaOH was added to the solutions before casting and the solution pH was 1.5. It is therefore possible that the observed deprotonation of P4VP in our films is not occurring in solution but upon spin coating of the polymer. After pyrolysis, no pyridine nitrogen K-edge peaks are observed, providing strong evidence that the polymer is fully combusted. Similar results have been obtained by Elmaci et al.22 for P4VP homopolymers.
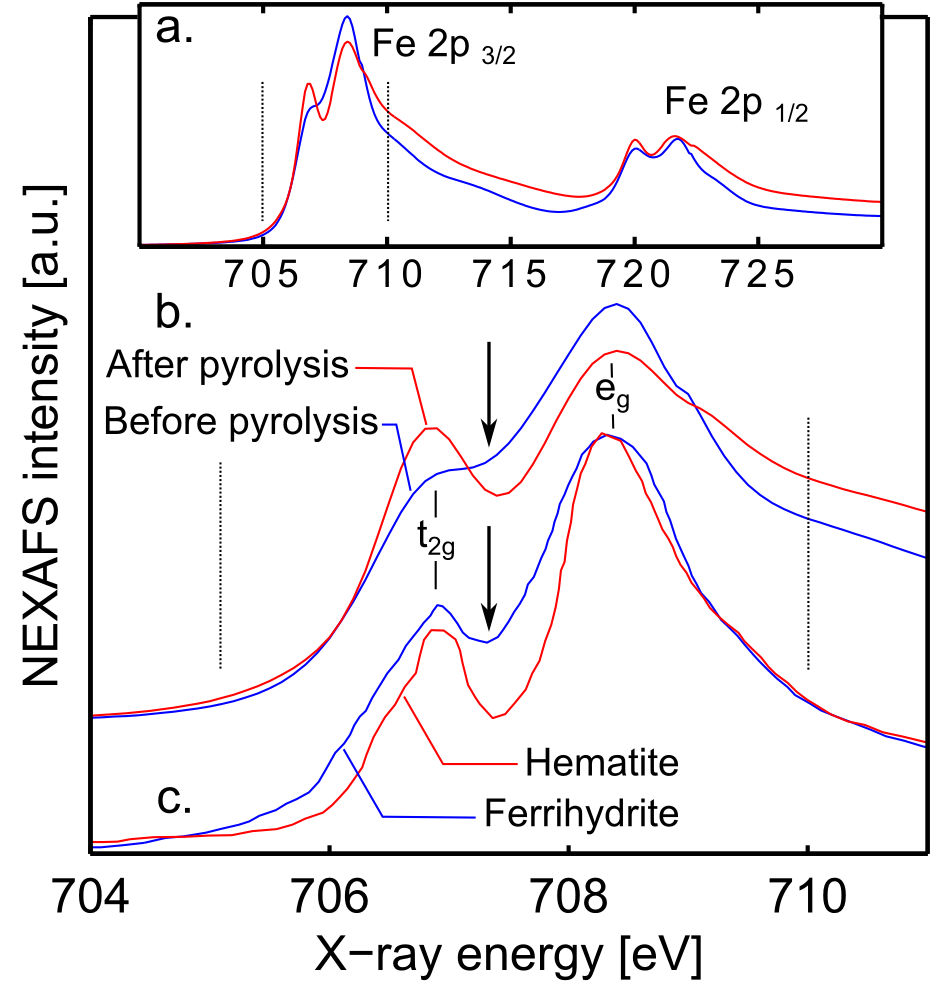
NEXAFS spectra obtained at the Fe L-edge show multiplet peaks corresponding to the transition from the 2p to the 3d orbitals (Fig. 6). Two sets of features can be observed, one in the L3 region (705-717 eV) and one in the L2 region (717-725 eV). For ease of spectral assignment, the spectra have been deconvoluted. The doublet observed in each region arises from the splitting of the 3d orbital of iron into two degenerate orbitals with eg and t2g symmetry due to the spin orbit coupling. Close inspection of the L3 peak at around 708 eV shows noticeable differences between the pre-pyrolysis and the post-pyrolysis samples. In the post-pyrolysis sample, the peak is sharper, with well-defined eg and t2g features with a width of around 1.2 eV. Spectra of iron oxide compounds with different structures containing Fe(III) have been studied by Peak et al.24 who observed that the presence of tetrahedral coordinated Fe(III) in compounds with predominantly octahedral coordinated Fe(III) tends to broaden the L3 peak, because the tetrahedral and the octahedral forms show proximate but not identical main peak positions. This suggests that our pre-pyrolysis sample does not yet fully constitute an iron oxide with octahedral Fe(III) centres, but still contains a significant amount of iron in a non-octahedral coordination geometry, which could be interpreted as presence of oxygen vacancies. In contrast, post-pyrolysis samples contain predominantly octahedral Fe(III) centres.
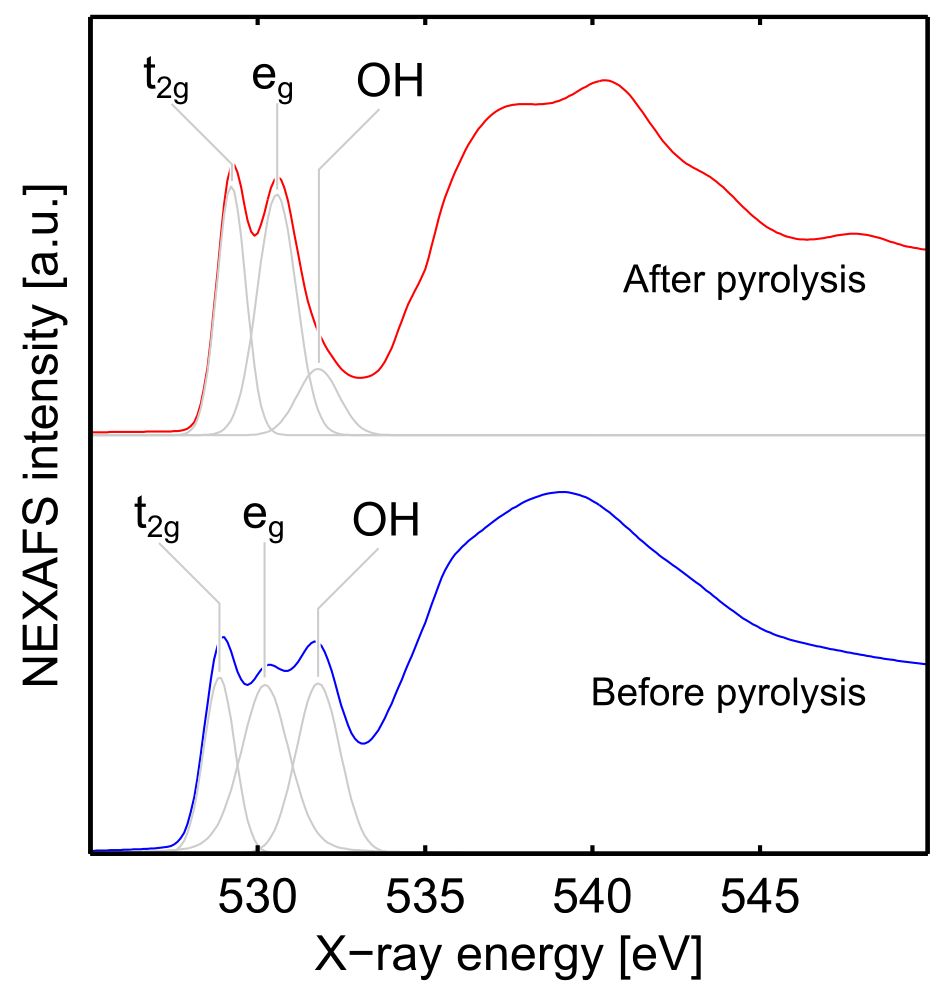
The O K-edge spectra also give relevant information about the structure. The pre-pyrolysis samples show a set of three peaks in the pre-edge region while the post-pyrolysis sample shows only two (Fig. 7). The peaks at 528.9 eV and 530.2 eV correspond to the transitions from the O 1s levels of O 2p to the Fe eg and t2g orbitals and the highest energy peak at 531.6 eV, which is only present before pyrolysis, has previously been observed in goethite samples by Todd et al.25 and assigned to the transition from the O 1s levels of OH- to the Fe 3d orbitals.
To summarise the Fe L-edge and O K-edge NEXAFS data, pre-pyrolysis samples contain both tetrahedral and octahedral Fe(III) centres indicating that the iron does not initially precipitate in an akaganèite form, as in the P4VP∕akaganèite nanocomposite material only containing octahedral centres obtained by Millan et al.21 . Oxidic structures containing both tetrahedral and octahedral Fe(III) centres include ferrihydrite (Fe2O3.1/2H2O) or maghemite (γ-Fe2O3). The O K-edge spectra further refine this structural elucidation and the strong peak observed at around 532 eV prior to pyrolysis is characteristic of an -OH group supporting the initial precipitation of ferrihydrite rather than maghemite. After pyrolysis, the Fe L-edge and O K-edge spectra perfectly match the spectra reported for hematite24,25,26. These data indicate that after spin-coating the aqueous FeCl3 precipitates into ferrihydrite which is converted into hematite upon pyrolysis.
This study shows that it is possible to destabilize thin polymer films loaded with an iron containing precursor. Self-organized nanostructures may be grown by means of a master nanostructured master electrode. After the electric field assisted self-organization, the film can be pyrolised, allowing the simultaneous combustion of the polymer and conversion of the iron into hematite. This chemical conversion is achieved with conservation of the nanostructure. These results are promising and introduce a methodology for the conversion of polymer-stabilised nanostructures to metal oxides nanostructures. The control offered by this technique on hematite structure opens the way to comprehensive studies of the nanostructure influence on the photoelectrochemical behavior of this material. Using this technique, even complex architechtures involving oxides heterojunction could be developed, based on the destabilization of multilayered thin films established by Morariu et al.27.
We acknowledge the financial support of the Swiss National Science Foundation for the project 137868 - Reaction-diffusion processes for the growth of patterned structures and architectures: a bottom-up approach for photoelectrochemical electrodes and the project 139698 (Self-organization processes to pattern thin films: A bottom-up approach for photoelectrodes).
The Helmholtz Zentrum Berlin is acknowledged for granting synchrotron beamtime under application number 2012-1-111500. We render thanks to Dr. Ruslan Ovsyannikov for his technical support during the synchrotron measurements. We appreciate the disposal of the Swiss Scanning Probe Microscopy User Laboratory at Empa and Dr. Ulrich Müller for his support. We acknowledge Dr. Tohru Araki for providing the N K-edge reference spectra for neutral and fully protonated P4VP.
[1] B. M. Kayes, H. A. Atwater, N. S. Lewis, Journal of Applied Physics 97 (2005) 114302. doi:10.1063/1.1901835.
[2] I. Balberg, H. L. Pinch, Journal of Magnetism and Magnetic Materials 7 (1978) 12–15. doi:10.1016/0304-8853(78)90138-5.
[3] J. H. Kennedy, K. W. Frese, Journal of the Electrochemical Society 125 (1978) 709–714. doi:10.1149/1.2131532.
[4] C. X. Kronawitter, L. Vayssieres, S. Shen, L. Guo, D. A. Wheeler, J. Z. Zhang, B. R. Antoun, S. S. Mao, Energy & Environmental Science 4 (2011) 3889–3899. doi:10.1039/c1ee02186a.
[5] R. R. Rangaraju, A. Panday, K. S. Raja, M. Misra, Journal of Physics D-applied Physics 42 (2009) 135303. doi:10.1088/0022-3727/42/13/135303.
[6] K. Xie, J. Li, Y. Lai, W. Lu, Z. Zhang, Y. Liu, L. Zhou, H. Huang, Electrochemistry Communications 13 (2011) 657–660. doi:10.1016/j.elecom.2011.03.040.
[7] N. E. Voicu, S. Ludwigs, U. Steiner, Advanced Materials 20 (2008) 3022–3027. doi:10.1002/adma.200702970.
[8] P. Goldberg-Oppenheimer, S. Mahajan, U. Steiner, Advanced Materials 24 (2012) OP175–OP180. doi:10.1002/adma.201104159.
[9] J. Heier, J. Groenewold, U. Steiner, Soft Matter 5 (2009) 3997–4005. doi:10.1039/b906863e.
[10] E. Schaffer, T. Thurn-Albrecht, T. P. Russell, U. Steiner, Nature 403 (2000) 874–877.
[11] N. Wu, I. Pease, Leonard F., W. B. Russel, Advanced Functional Materials 16 (2006) 1992–1999. doi:10.1002/adfm.200600092.
[12] N. E. Voicu, M. S. M. Saifullah, K. R. V. Subramanian, M. E. Welland, U. Steiner, Soft Matter 3 (2007) 554–557. doi:10.1039/b616538a.
[13] L. C. Arslan, C. Sanborn, E. Anzenberg, J. Ludwig, Karl F., Physical Review Letters 109 (2012) 106102. doi:10.1103/PhysRevLett.109.106102.
[14] F. Family, P. Meakin, Physical Review A 40 (1989) 3836–3854. doi:10.1103/PhysRevA.40.3836.
[15] N. E. Zander, J. A. Orlicki, A. M. Rawlett, Abstracts of Papers of the American Chemical Society 238 (2009).
[16] C. X. Guan, D. G. Chen, W. J. Tang, C. H. Liu, Journal of Applied Polymer Science 97 (2005) 1875–1879. doi:10.1002/app.21465.
[17] L. F. Pease, W. B. Russel, Langmuir 20 (2004) 795–804. doi:10.1021/la035022o.
[18] J. Stöhr, NEXAFS Spectroscopy, Springer, 1992.
[19] C. Hennig, K. H. Hallmeier, R. Szargan, Synthetic Metals 92 (1998) 161–166. doi:10.1016/S0379-6779(98)80106-9.
[20] A. Millan, F. Palacio, A. Falqui, E. Snoeck, V. Serin, A. Bhattacharjee, V. Ksenofontov, P. Guetlich, I. Gilbert, Acta Materialia 55 (2007) 2201–2209. doi:10.1016/j.actamat.2006.11.020.
[21] A. Millan, A. Urtizberea, E. Natividad, F. Luis, N. J. O. Silva, F. Palacio, I. Mayoral, M. L. Ruiz-Gonzalez, J. M. Gonzalez-Calbet, P. Lecante, V. Serin, Polymer 50 (2009) 1088–1094. doi:10.1016/j.polymer.2009.01.034.
[22] A. Elmaci, J. Hacaloglu, Polymer Degradation and Stability 94 (2009) 738–743. doi:10.1016/j.polymdegradstab.2008.12.016.
[23] S. Fujii, S. P. Armes, T. Araki, H. Ade, Journal of the American Chemical Society 127 (2005) 16808–16809. doi:10.1021/ja056589p.
[24] D. Peak, T. Regier, Environmental Science & Technology 46 (2012) 3163–3168. doi:10.1021/es203816x.
[25] E. C. Todd, D. M. Sherman, J. A. Purton, Geochimica Et Cosmochimica Acta 67 (2003) PII S0016–7037(02)00957–2. doi:10.1016/S0016-7037(02)00957-2.
[26] D. K. Bora, A. Braun, S. Erat, A. K. Ariffin, R. Loehnert, K. Sivula, J. Toepfer, M. Graetzel, R. Manzke, T. Graule, E. C. Constable, Journal of Physical Chemistry C 115 (2011) 5619–5625. doi:10.1021/jp108230r.
[27] M. D. Morariu, N. E. Voicu, E. Schaffer, Z. Q. Lin, T. P. Russell, U. Steiner, Nature Materials 2 (2003) 48–52. doi:10.1038/nmat789.