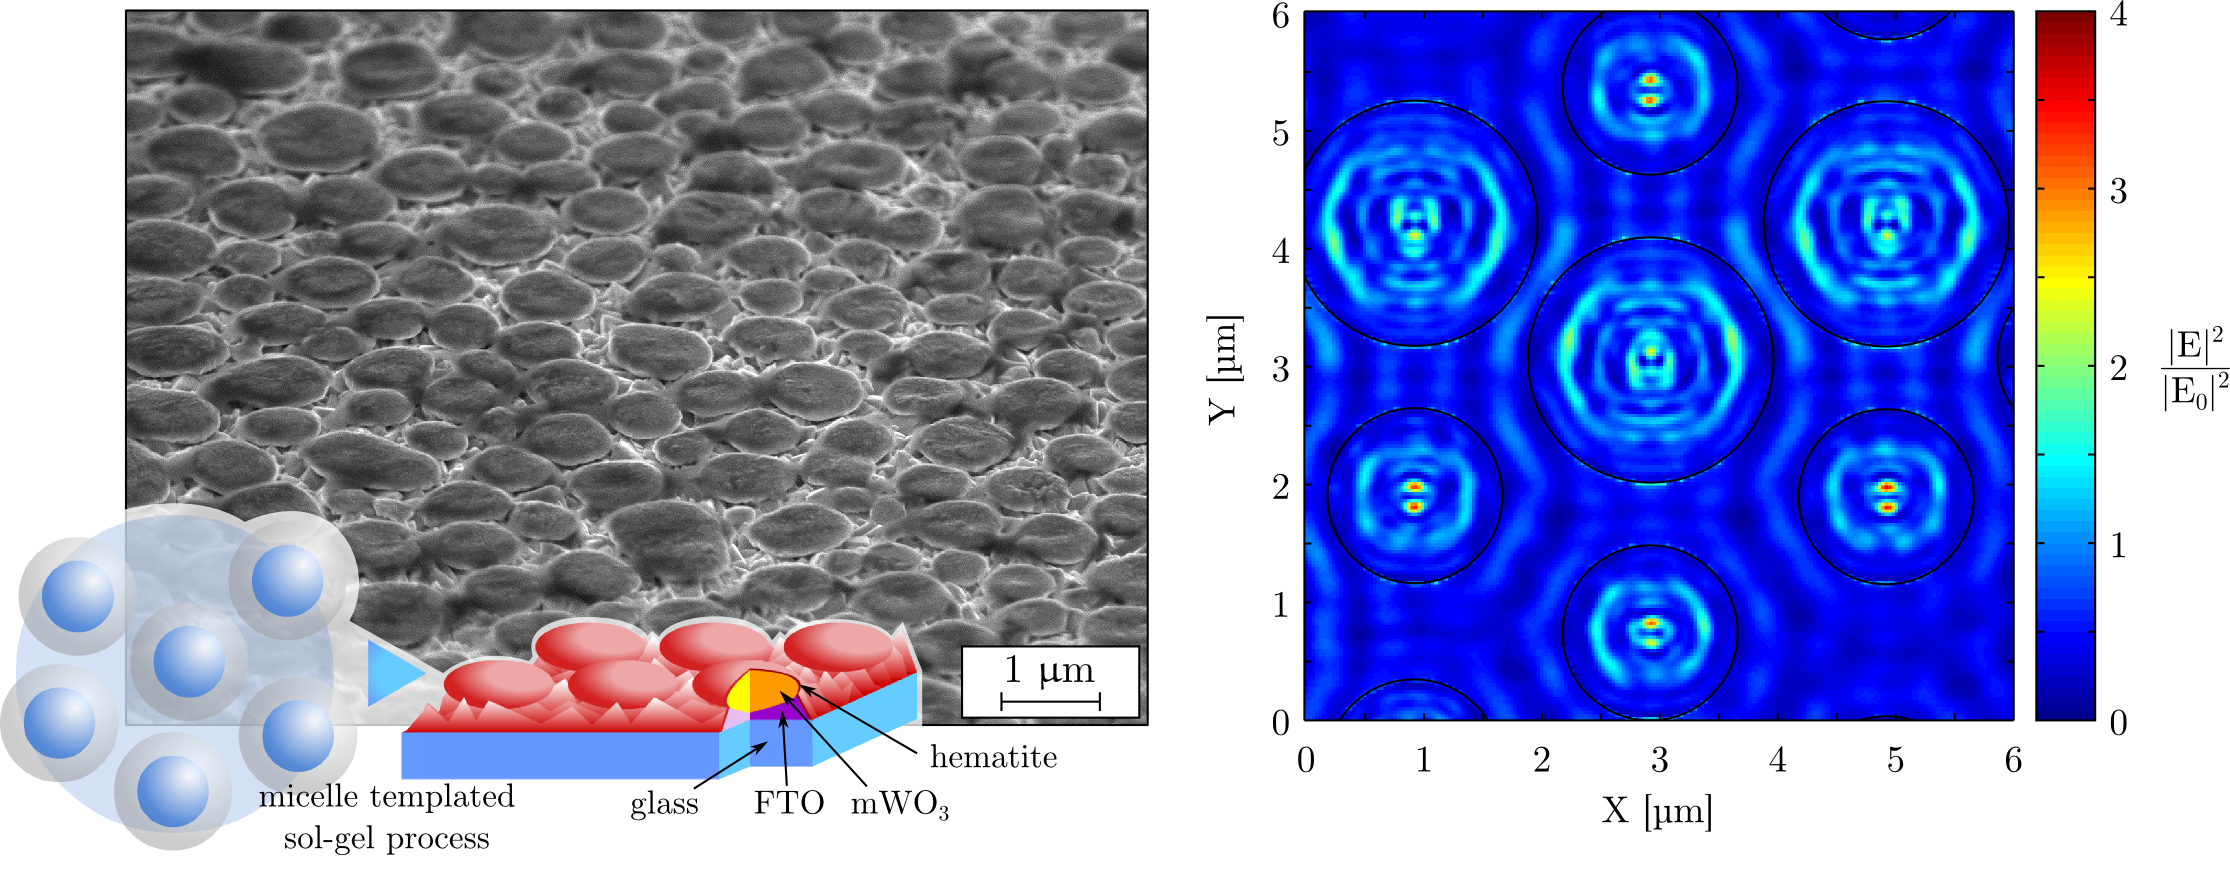
SEM picture of the microspheroids (tilted), scheme depicting the vesicle templated sol-gel process and squared normalized electric field intensity distribution inside the microspheroid calculated by Finite-Difference Time-Domain simulation.
Florent Boudoire,*a,c Rita Toth,a Jakob Heier,b Artur Braun,a and Edwin C. Constablec
*florent.boudoire@empa.ch
aLaboratory for High Performance Ceramics
Empa, Swiss Federal Laboratories for Materials Science and Technology
Überlandstr. 129, CH-8600, Dübendorf, Switzerland.
bLaboratory for Functional Polymers
Empa, Swiss Federal Laboratories for Materials Science and Technology
Überlandstr. 129, CH-8600, Dübendorf, Switzerland.
cDepartment of Chemistry
University of Basel
Spitalstr. 51, CH-4056 Basel, Switzerland.
Thin films involving an oxide heterojunction are increasingly employed as electrodes for solar water splitting in photoelectrochemical cells. Hematite (α-Fe2O3) and tungsten oxide form an attractive heterojunction for this purpose. A major limitation of this strategy is the short charge carrier diffusion length in hematite. Ultra-thin films were implemented to address this low conductivity issue. Nevertheless, such ultrathin films do not absorb light efficiently. The present study explores light trapping strategies to increase the optical path length of photons in hematite. Vesicle suspensions were developed to obtain thin films composed of microspheroids array with a tungsten oxide core and nanometer size hematite overlayer. This bottom-up approach allows a fine control of the spheroids dimensions at the micrometric to submicrometric scale. Using the Finite Difference Time Domain method, light propagation inside the microstructures was quantitatively simulated. The simulation results were coupled to an analysis of the photoelectrochemical response of the films. Experiments and simulation show quantitative agreement and bring important insights in the relationship between the interaction of light with the microstructure and the photoanode performance.
Hydrogen production by solar water splitting in photoelectrochemical cells (PEC) is one of the technologies that could lead to economically viable hydrogen economy. This technology is based on photo-electrolysis of water and allows to split water into O2 (anode) and H2 (cathode). If photoactive materials are used to harness solar light, and provide the electric voltage needed to split water, H2 is produced without generation of harmful byproducts and can be easily collected at the cathode. Compared to other solar hydrogen technologies, PEC cells are beneficial in terms of system integration since PEC electrodes combine light absorption and electrocatalysis.
A major problem encountered when developing photoelectrode materials based on inorganic semiconductors is the combination of a low conductivity and limited light absorption. In the present study we propose to address this fundamental limitation by combining two different approaches: matching the electronic structure and optical properties of two different semiconductors and controlling their microstructure to implement light management strategies.
Tungsten oxide (mWO3) and hematite (α-Fe2O3) have been extensively studied as photoanode materials for solar water splitting. These two oxides possess a valence band at energy lower than the oxygen evolution reaction potential, allowing to catalyse this reaction by providing photogenerated holes at their surface. Moreover their narrow band gap allows light absorption in the near UV by the tungsten oxide and in the visible range by hematite. State of the art hematite photoelectrodes, prepared by atmospheric pressure chemical vapor deposition, reach 3.3 mA.cm-2 at 1.43 VRHE1, while mWO3 photoelectrodes can reach around 3 mA.cm-2 at the same potential for micrometer thick films2. Some studies aimed at coupling hematite and mWO3 in an oxide heterojunction3,4,5,6. Coupling these two oxides in a heterojunction would allow absorption of up to 35% of the solar power spectrum. In addition, a depletion layer that can improve the separation of the photogenerated hole/electron pairs is forming at the mWO3/hematite junction, emerging from a favorable matching of the valence and conduction bands in those materials.
Such design is nevertheless hindered by the low conductivity of hematite. Kennedy and Frese7 reported that the charge carrier diffusion length in hematite was close to 5 nm and further studies by Le Formal et al.8 point to even shorter lengths (1-2 nm). This diffusion length is one order of magnitude shorter than hematite’s optical thickness (44.6 nm at a wavelength of 400 nm9). Therefore, the full capability of hematite cannot be achieved in the case of a flat thin film geometry where increasing the film thickness would lead to more charge carrier accumulation (charging) and decreasing the film thickness would lead to less light absorption. Doping of hematite is one strategy to increase hematite conductivity10,11,12,13 but this study focuses on the case of pristine hematite films. In the present study we propose to decouple light absorption from hematite’s thickness using light management strategies.
Light trapping strategies were developed recently to increase light absorption in thin hematite films14,15. Dotan et al. used reflecting coatings and took advantage of resonant light trapping using multiple reflections in a flat hematite film on a reflective surface. Gao et al. used nanostructured gold films to obtain both surface plasmons and light trapping effects. The aim of our study is to combine light management and production of an all-oxide heterojunction. We implemented a self-organization process to obtain mWO3 film composed of a two dimensional distribution of micrometric to submicrometric spheroids.
Dielectric spheroids of near wavelength dimensions are known to support confined resonant modes16,17,18. mWO3 is a material of choice in order to confine light, since it possesses a high refractive index for visible light wavelengths (2.2 to 3.7 for crystalline mWO319) and provide a strong refractive index contrast compared to the ambient medium, which in the present case is an aqueous electrolyte. By coating these mWO3 spheroids with an ultra-thin hematite film, a semiconductor heterojunction is achieved and charge carrier recollection is enhanced. At the same time the interaction of light with the microstructure allows to decouple light absorption and thickness of the hematite film. This way a significant contribution of the hematite ultra-thin film to the photocurrent density was observed.
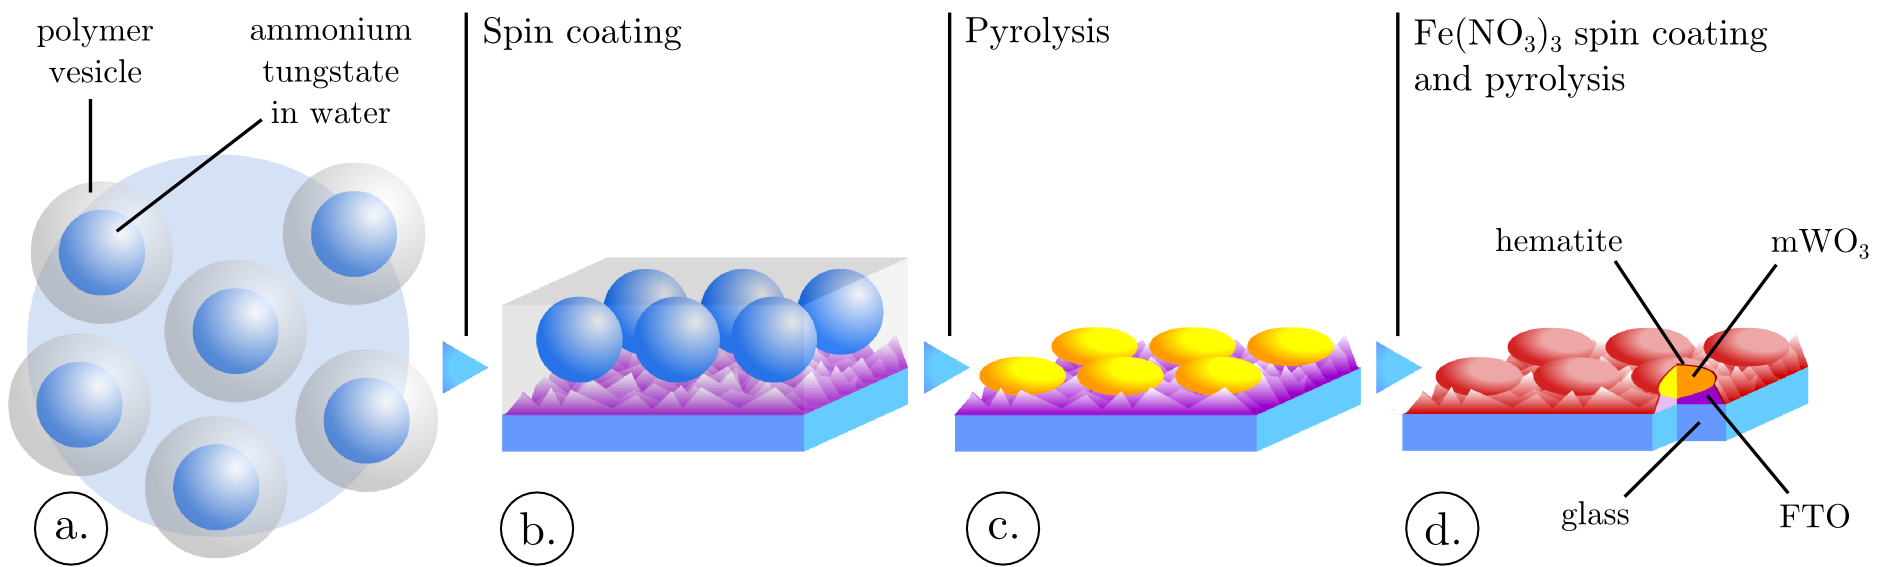
Tungsten oxide spheroids coated on a conductive substrate were obtained by a self-organization process similar to the micelle-templated synthesis route20,21,22,23,24. A suspension of polymer vesicles enclosing a tungsten salt was spin coated and subsequently pyrolysed. This vesicle suspension was produced by mixing an aqueous ammonium tungstate solution to polystyrene sulfonic acid (PSS) (Figure 1 a.). PSS can exhibit an amphiphilic behavior and micelle formation was previously reported for this polymer by Basavaiah et al.24. In the present case, PSS micelles might have evolved toward a different phase, vesicles, involving the formation of a lipid bilayer organized in a spheroidal shape. This suspension was casted on fluorinated tin oxide coated glass (FTO glass) leading to the formation of a monolayer of vesicles (Figure 1 b.). Subsequent pyrolysis of these vesicles led to the formation of the mWO3 spheroids (Figure 1 c.).
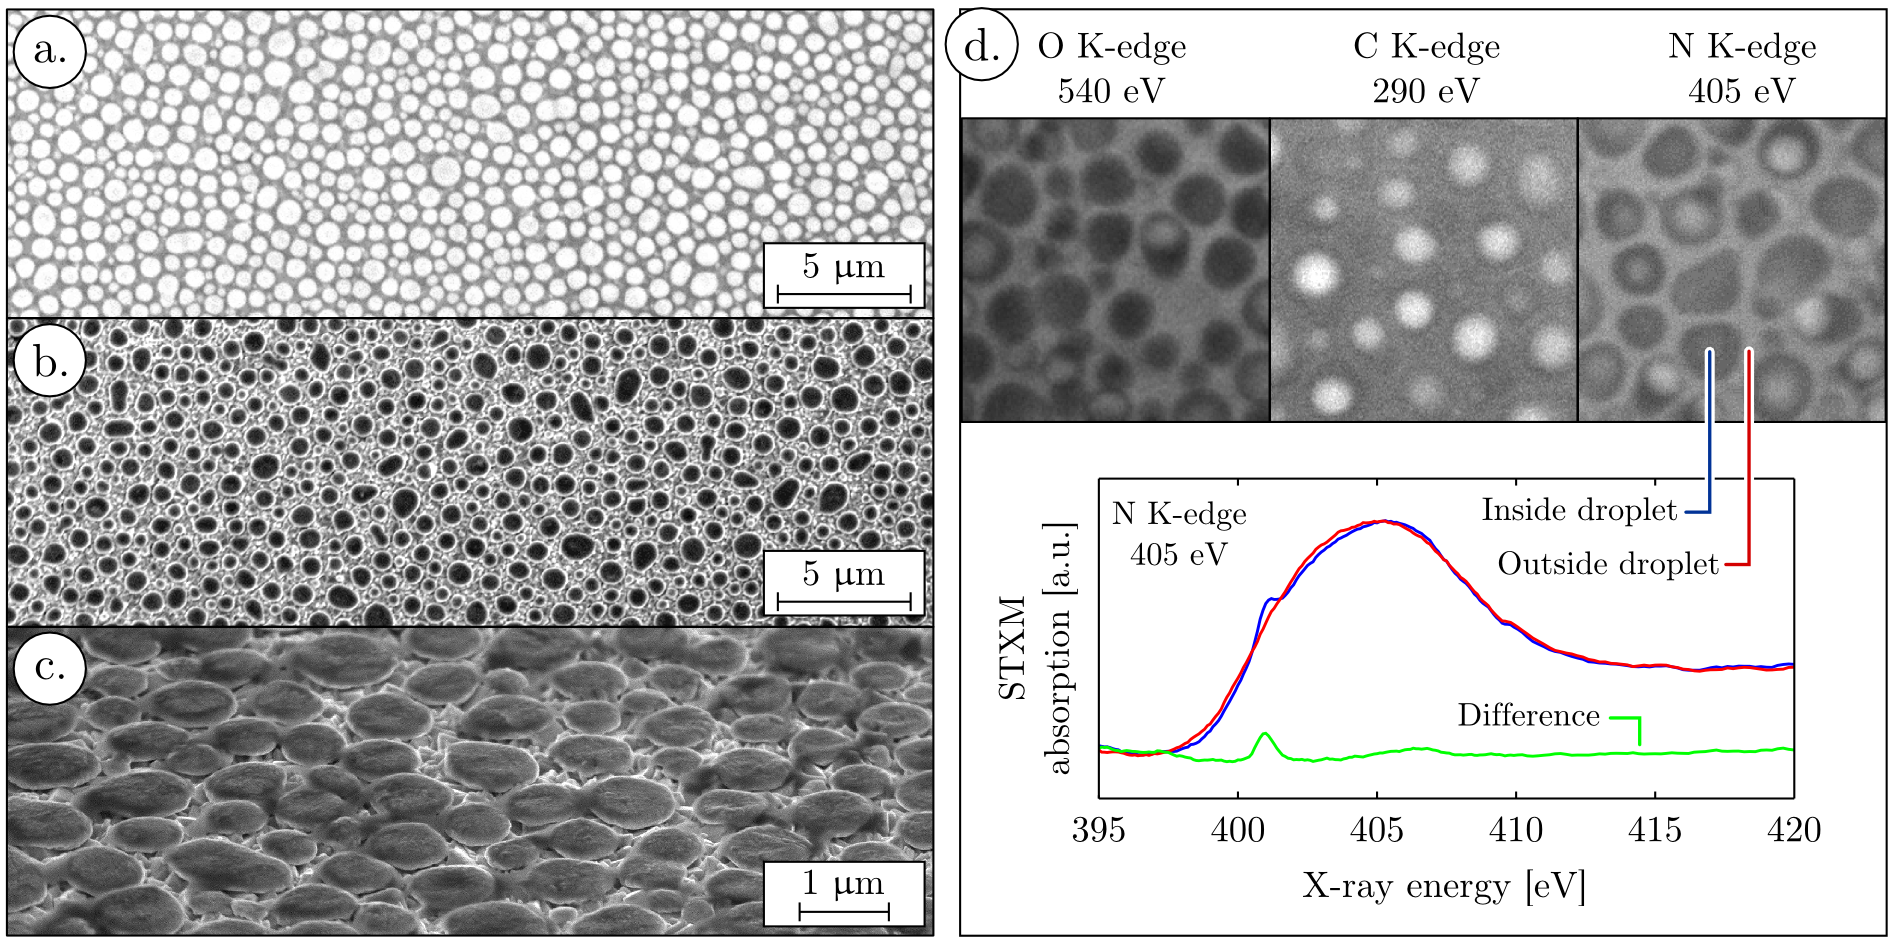
Prior to pyrolysis, the film microstructure was studied by scanning electron microscopy (SEM) (Figure 2 a. to c.) and scanning transmission X-ray microspectroscopy (STXM) (Figure 2 d.). SEM micrographs show that upon spin coating of the aqueous ammonium tungstate / PSS solution, the polymer vesicles are stabilized and droplets embedded in a matrix are observed. This electron micrograph was realized by recording secondary electrons and the matrix appears darker than the droplets due to charging effects. This contrast is not linked to the film topography but rather to differences in conductivity. The film surface before pyrolysis is indeed flat at the nanometer scale (see Supporting Information, Figure II).
X-ray absorption with spatial resolution was also recorded on this film (Figure 2 d.). This X-ray absorption microscopy experiment was realized at Helmoltz Zentrum’s Bessy II synchrotron in Berlin, beamline U41-FSGM, end station U41-TXM. STXM images prove that the matrix, between the droplets, is formed by the polymer, since the absorption at the carbon K-edge is higher in these regions. The droplets have a higher absorption of X-rays at the oxygen K-edge and can therefore contain some remaining water. Less absorption contrast is obtained at the nitrogen K-edge, because the substrates used for the STXM measurements are silicon nitride windows, also containing nitrogen in an amorphous phase. Nevertheless, a fine structure is present in the nitrogen K-edge spectra recorded inside the droplets which is absent outside the droplets. A similar peak at the nitrogen K-edge was observed by different authors25,26 in (NH4)2SO4 samples. This spectral feature corresponds to the well-known nitrogen 1s→π* transition in ammonium ions and proves the localization of ammonium tungstate inside the droplets.
This correlated SEM and STXM study proves that polystyrene sulfonic acid is forming vesicles enclosing the ammonium tungstate precursor. A monolayer of those vesicles is coated onto the substrate during the spin coating. Upon pyrolysis the polymer vesicles act as microreactors constraining the mWO3 crystallisation to spheroid shape with controlled dimensions. The phase and crystallinity of the mWO3 phase was confirmed by X-ray diffraction (see Supporting Information, Figure I).
An ultra-thin hematite film was casted on top of this mWO3 film composed of spheroids. This film was produced by pyrolysis of a spin coated Fe(NO3)3 salt dissolved in ethanol (Figure 1 d.). By tuning the concentration of Fe(NO3)3 different hematite thicknesses were obtained. Due to the strong scattering linked to the mWO3 microstructure, the thickness of the hematite layer coated on the mWO3 could not be measured by UV-visible spectroscopy. Therefore, the hematite films were first casted on transparent substrates (bare FTO glass) and analyzed by absorption spectroscopy (see Supporting Information, Figure IV). Characteristic hematite spectra were obtained. Assuming a Lambertian absorption and negligible reflection, the film thicknesses was calculated using the Beer-Lambert law:
 | (1) |
In this relation, L is the film thickness, α the absorption coefficient of hematite for a wavelength of 400 nm and A the absorbance measured at 400 nm. The absorption coefficient value of hematite at 400 nm was set to 2.24×10⁻² nm-1 according to Marusak et al.9. A linear relationship (see Supporting Information, Figure V) was observed between the Fe(NO3)3 concentration ([Fe(NO3)3]) and the hematite film thickness upon pyrolysis (L): L = 52 × [Fe(NO3)3]
No photocurrent was observed for these plain hematite films casted on bare FTO substrates, for all screened thicknesses. In order to observe the influence of the film thickness on the photocurrent, hematite ultra-thin films with thicknesses ranging from a few nanometer to 30 nm were casted on microstructured mWO3 thin films. Due to the junction formed with mWO3, and light trapping effects, a significant contribution of hematite to the photocurrent could be recorded. Similar wetting behavior was observed experimentally when casting the iron solution on bare FTO substrates and mWO3 coated FTO substrates. In addition charging effects in hematite, which will be discussed in details later in this paper, have a similar evolution as a function of the Fe(NO3)3 concentration when coated on mWO3 and on bare FTO substrates (see Supporting Information, Figure VI). We therefore conclude that the observations of hematite thicknesses performed on bare FTO substrates can be applied to the mWO3 coated FTO substrates case.
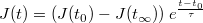
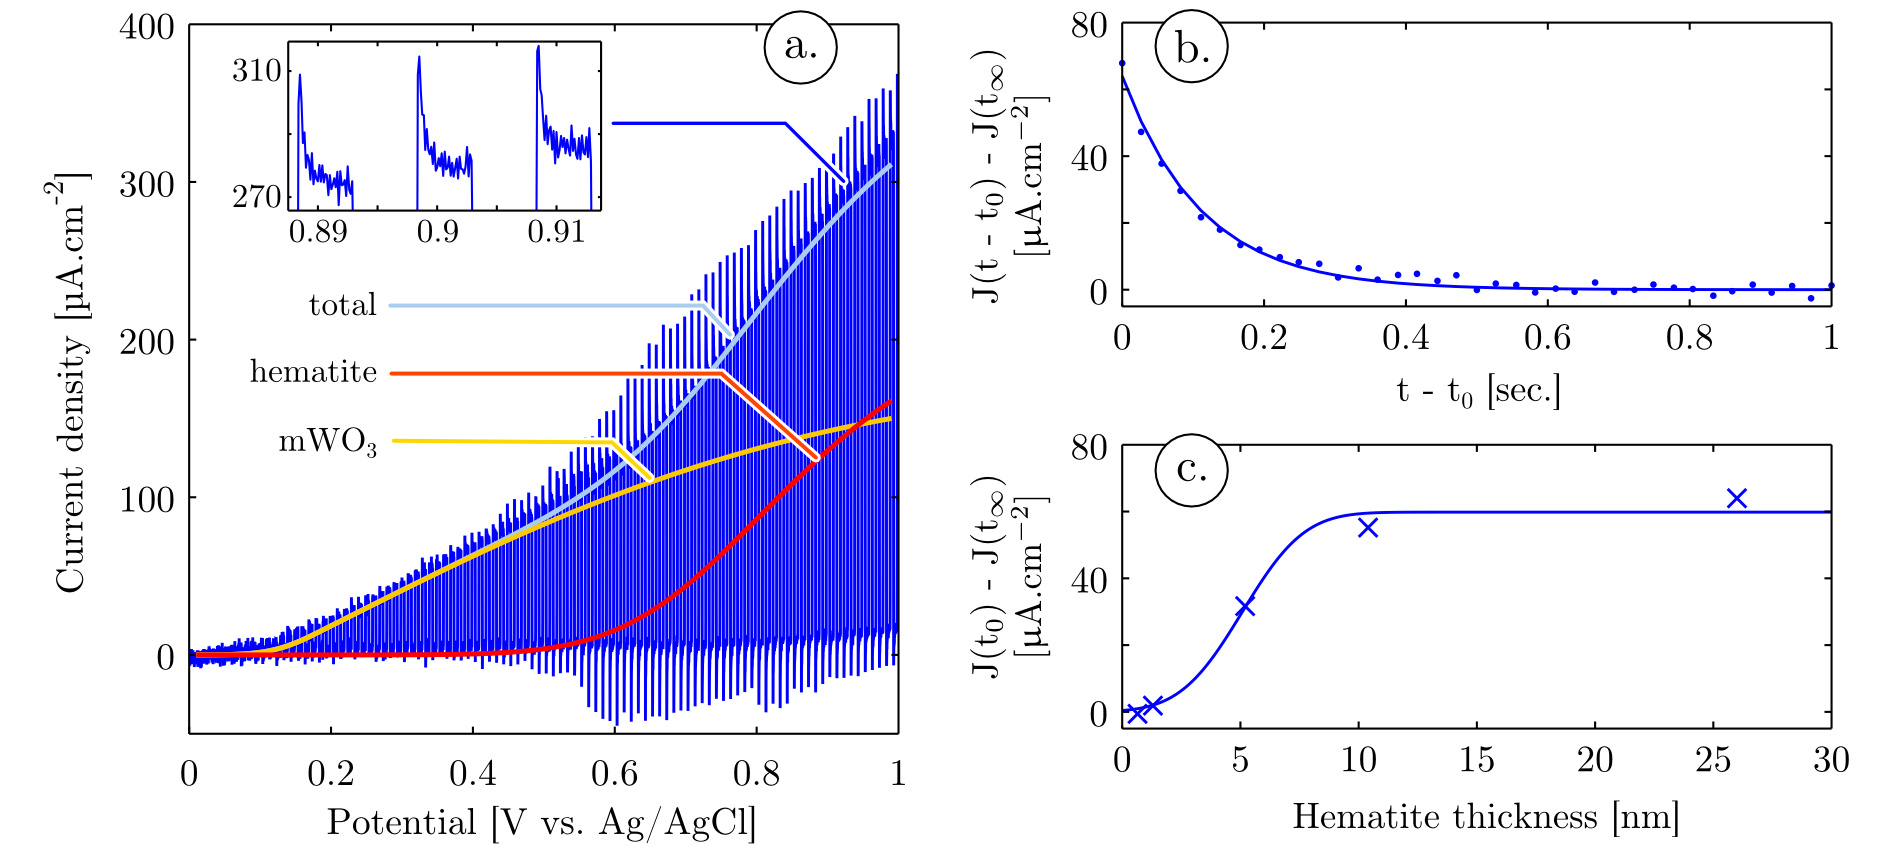
The curve presented in Figure 3 a. (light blue) shows a characteristic photocurrent/voltage signature obtained with the mWO3 film composed of spheroids, coated with an ulta-thin hematite overlayer. This curve can be deconvoluted into two sigmoids. One of the sigmoid corresponds to the photocurrent generated by the mWO3, which has an onset potential at around 0.2 V vs Ag/AgCl (yellow curve) and the second sigmoid corresponds to hematite, with an onset potential positioned at around 0.6 V vs Ag/AgCl (red curve). This difference is linked to a down shift of the conduction band in mWO3 compared to hematite that provides mWO3 with a better catalytic activity regarding the oxygen evolution reaction. A systematic study of the charging effects observed when chopping the light and monitoring the photocurrent response allowed to quantify the recombination length of the charge carrier in our hematite films (Figure 3 a., deep blue curve). When measuring the photocurrent at different potentials while opening / closing the light incident to the sample with a frequency of 1 Hz, transient phenomena can be characterized. These transient phenomena correspond to charging / discharging effects that are linked to the poor conductivity of hematite8,27,28. In a similar approach to Le Formal et al.8 the discharging occurring in hematite after opening of the light shutter can be fitted by a single exponential:
 | (2) |
In this formula, J(t∞) is the photocurrent density at equilibrium, t0 is the time when the light shutter is opened and τ is the characteristic decay time of the exponential. One example of this fitting procedure is presented in Figure 3 b. When plotting J(t0) - J(t∞), which gives the amplitude of charging, depending on the hematite thickness (Figure 3 c.), it is obvious that the charge carrier recombination is hindered when the hematite thickness is below 10 nm. This drastic decrease in charging for hematite films with a few nanometer thicknesses is well matching the values reported in the literature for the charge carrier recombination length in hematite7,8. The optimal photocurrent has been obtained for a hematite thickness of 5 nm, where the film is thin enough for efficient charge carrier collection. The decrease in photocurrent observed for hematite thickness of 1-3 nm can be attributed to lower light absorption. Therefore the optimized hematite thickness that has been used to study the impact of light trapping is 5 nm, which constitutes a good compromise between light absorption and charge carrier transport.
After the impact of the hematite film thickness on its charging was quantitatively analyzed and the hematite film thickness optimized to 5 nm, light trapping inside the different microstructures and its impact on the photoelectrochemical properties of the photoanodes were studied. A strong advantage procured by the bottom-up approach implemented in this study is the possibility to easily control the mWO3 spheroid sizes in the micrometric to submicrometric range. By changing one parameter of the mWO3 film casting, the spin coating speed, different film thickness are obtained. The polymer vesicle sizes are determined by the film thickness. Thinner films allow the stabilization of more surface energy, breaking the vesicles into smaller entities upon casting. After pyrolysis of films processed at different spin coating speeds, mWO3 thin films composed of spheroids with different size distributions are obtained. Atomic force spectroscopy (AFM) linescans performed on these films show that the pillar diameter varies from 1.2 μm to 0.5 μm (Figure 4 a.). Their aspect ratio is constant and approximately equal to 1/3 (height/diameter) for all the screened spin coating speeds.
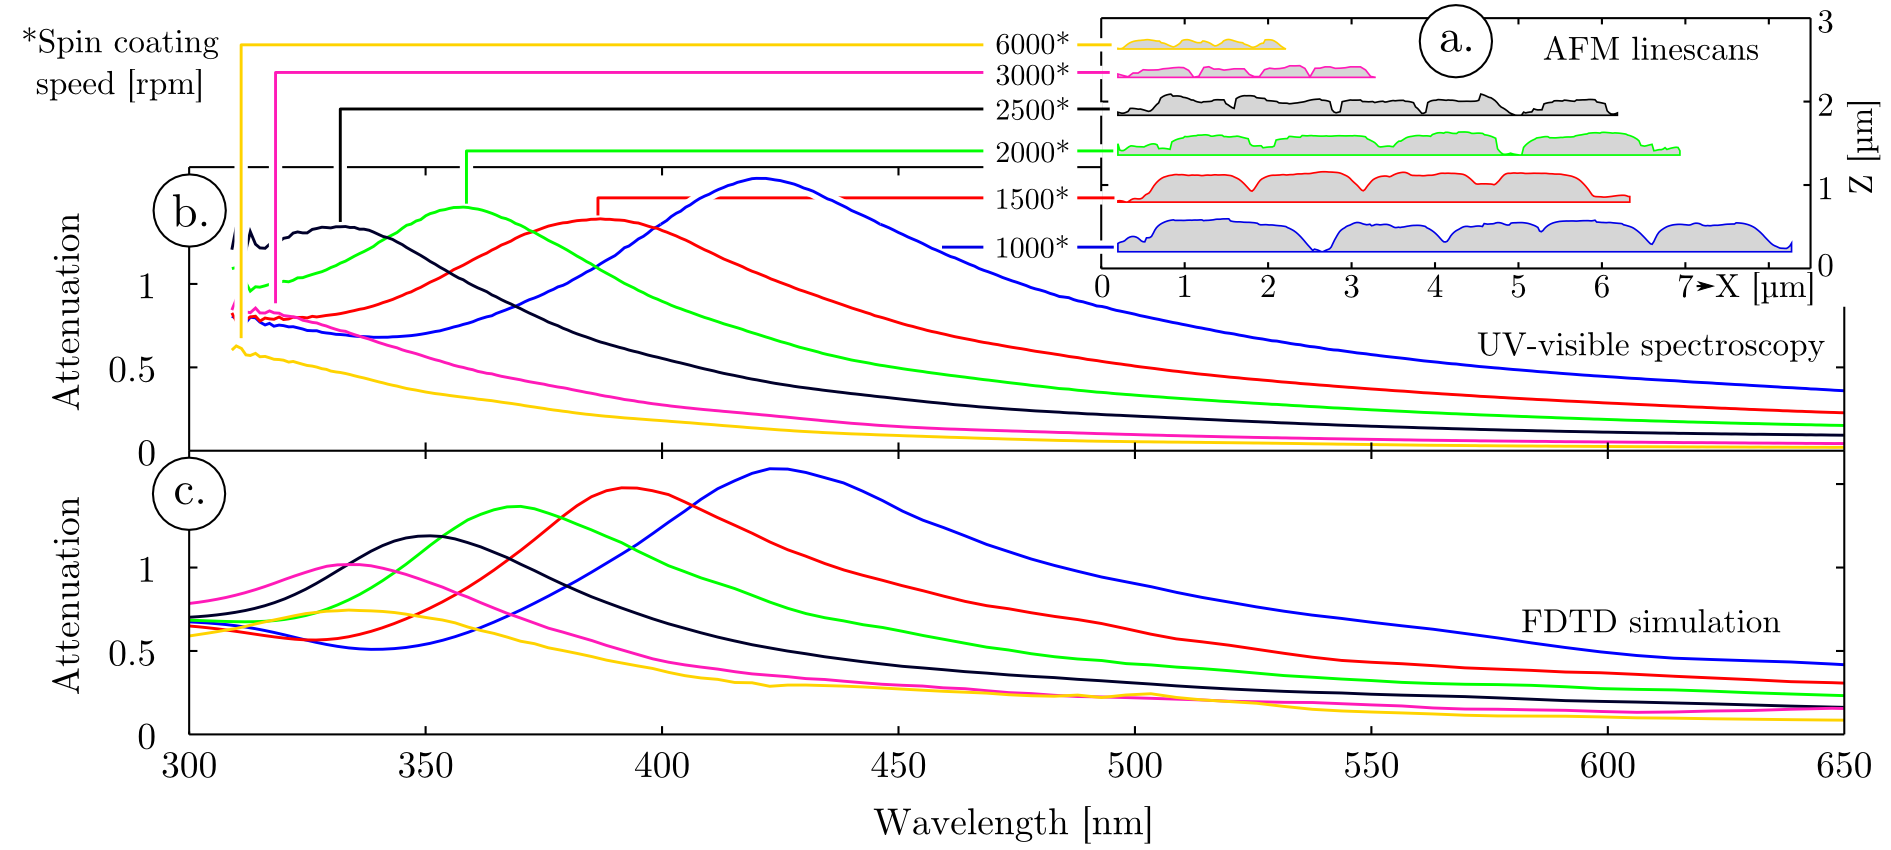
It appears that the light trapping function of these mWO3 films is closely related to their microstructure. A strong attenuation peak was observed in absorption spectroscopy experiments (Figure 4 b.) for all screened spheroid sizes, and this peak position is strongly influenced by the characteristic dimensions of the coated spheroids. These peaks could not be attributed to the chemical composition of the films, since they do not emerge from the absorption of hematite or mWO3 but rather from the interaction of light with the microstructure. These attenuation peaks are related to diffraction phenomena, and far field scattering patterns (not shown here) shows photonic jets forming at wavelengths where the absorption peaks are significant. Tuning the spheroids size distribution allows to tune the wavelength range of this light interaction with the microstructure, with a shift of the attenuation peak to shorter wavelengths when decreasing the spheroid sizes.
In order to understand how the light behaves for these different regimes and to see whether light trapping can be achieved in such microstructures, numerical simulations were performed. Specifically, the distribution of the electric field inside the spheroids upon simulated solar light illumination was mathematically modelled. A commercial-grade simulator based on the finite-difference time-domain method was used to perform the calculations29. The films microstructure was modeled by oblate coated spheroids with height and diameter representative of the size distributions obtained by SEM and AFM image processing. In order to validate the microstructure modelization, far field projections of the electric field were calculated and simulated attenuation spectra were obtained for each microstructure (Figure 4 c.). When comparing simulated and experimental attenuation spectra a quantitative match is observed between the attenuation peak position and width, due to scattering, for each microstructure. Therefore the model implemented in the simulation is representative of the experimental conditions and can be used to gain quantitative understanding of the light / microstructure interaction. Moreover FDTD simulation is based on classical electrodynamic and is neglecting quantum size effects. Therefore the close match between simulation and experiments proves that the attenuation peak observed experimentally, as well as the blue shift of this peak when decreasing the microspheroids dimensions, is a consequence of the film microstructure, and possible quantum size effects on light absorption can be neglected. The electric field distributions inside hematite and mWO3 were obtained from the simulation. It is therefore possible to integrate the electric field inside hematite and mWO3 and calculate the power absorbed in each materials using the divergence of the Poynting vector:
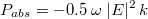 | (3) |
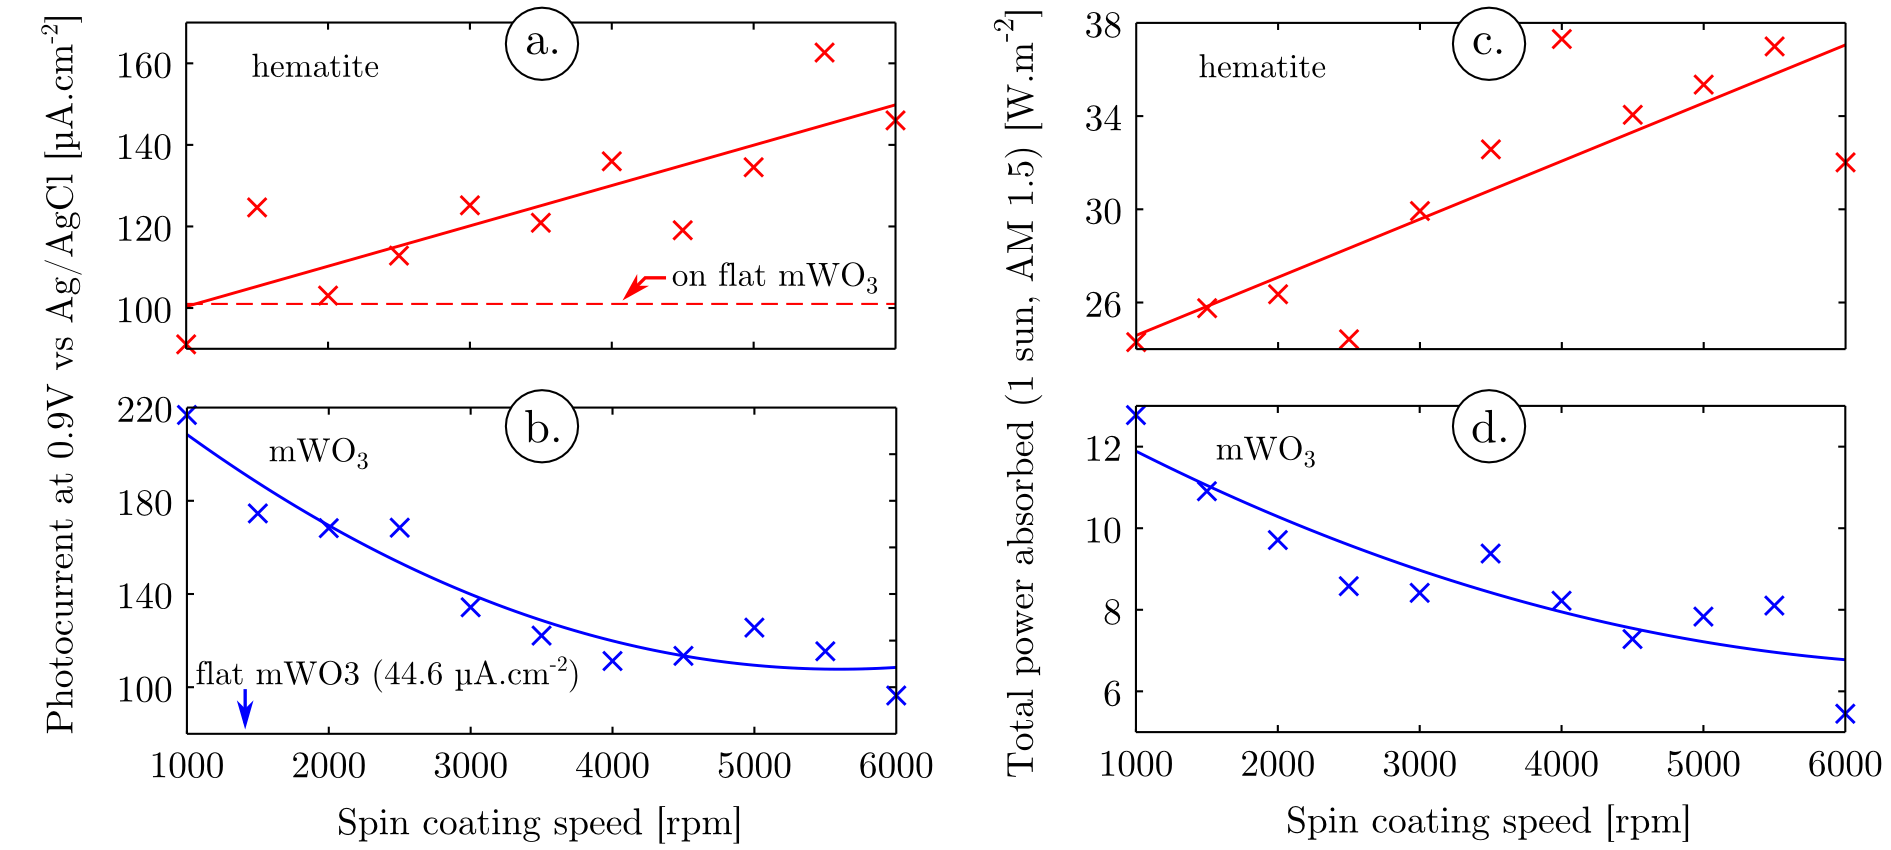
with ω the angular velocity, E the electric field, and k the imaginary part of the refractive index. By integrating the power absorbed over the wavelength range between 300 and 800 nm, taking into account the irradiance of 1 sun at AM 1.5, the total power absorbed in each oxide under simulated solar conditions has been obtained for the different microstructures (Figure 5 c. and d.). As shown in Figure 5 c. and d., when decreasing the spheroid sizes (increasing the spin coating speed), the power absorbed in hematite is increased while the power absorbed in mWO3 is decreased. These tendencies can be explained by changes in the interaction of light with the film depending on the spheroid size distribution.
The aim of this study is to prove that light trapping in our original microstructures impacts the photoelectrochemical properties of the films. To probe the photoelectrochemical properties of the films, photocurrent densities at varying potentials were measured on the films with different spheroid size distributions. These films were measured at pH = 7 in a 0.05M PBS electrolyte. Different behaviors were obtained depending on the mWO3 microstructure (see Supporting Information, Figure VIII). For all microstructures a similar shape of the photocurrent was obtained, allowing a clear distinction between hematite and mWO3 contributions to the photocurrent densities. The photocurrents show a clear trend, an increase of the hematite contribution to the photocurrent and a decrease of the mWO3 contribution to the photocurrent when decreasing the mWO3 spheroid sizes (i.e. increasing the spin coating speed).
In order to characterize these variations quantitatively, a deconvolution of the photocurrent into two sigmoidal contributions was performed on each photocurrent / voltage curves, using a similar procedure as the one presented in Figure 3 a. In the Figure 5 a. and b., the values of the deconvoluted contribution of mWO3 and hematite photocurrents at 0.9 V vs Ag(AgCl) were plotted for the different microstructure. The trend observed in the contribution of each oxide confirms the qualitative assertions, that the photoactivity of hematite is increasing while the photoactivity of mWO3 is decreasing when the spheroid sizes are decreasing. An additional information obtained through this deconvolution is that the onset potentials for mWO3 and hematite are invariant with the different microstructures, hence the change in microstructure do not influence the catalytic properties of the oxides.
In addition we compared the photocurrent density obtained with a flat mWO3 film, coated with hematite, to the photocurrent densities obtained with microstructured films (see Supporting Information, Figure VII). The photonic effects provide a two to four fold enhancement of mWO3 photoactivity (Figure 5 b.). Hematite already benefits from a significant photoactivity in the flat film design because of the heterojunction with mWO3. Nevertheless for the smallest spheroid sizes a 1.5 fold enhancement is observed for this oxide (Figure 5 a.).
The variation of simulated solar power absorbed in the different oxides, due to different light / microstructure interaction regime, is closely matching the variations observed in their photoactivities (Figures 5). This strong correlation therefore proves that photonic effects in spheroid-like microstructures have a significant influence on the photoactivity of hematite / mWO3 heterojunctions implemented in a photoanode. It shows that light concentration is shifting when the microspheroid sizes are decreased, from the center of the spheroids where mWO3 is present, toward the surface of the spheroids and the hematite overlay.
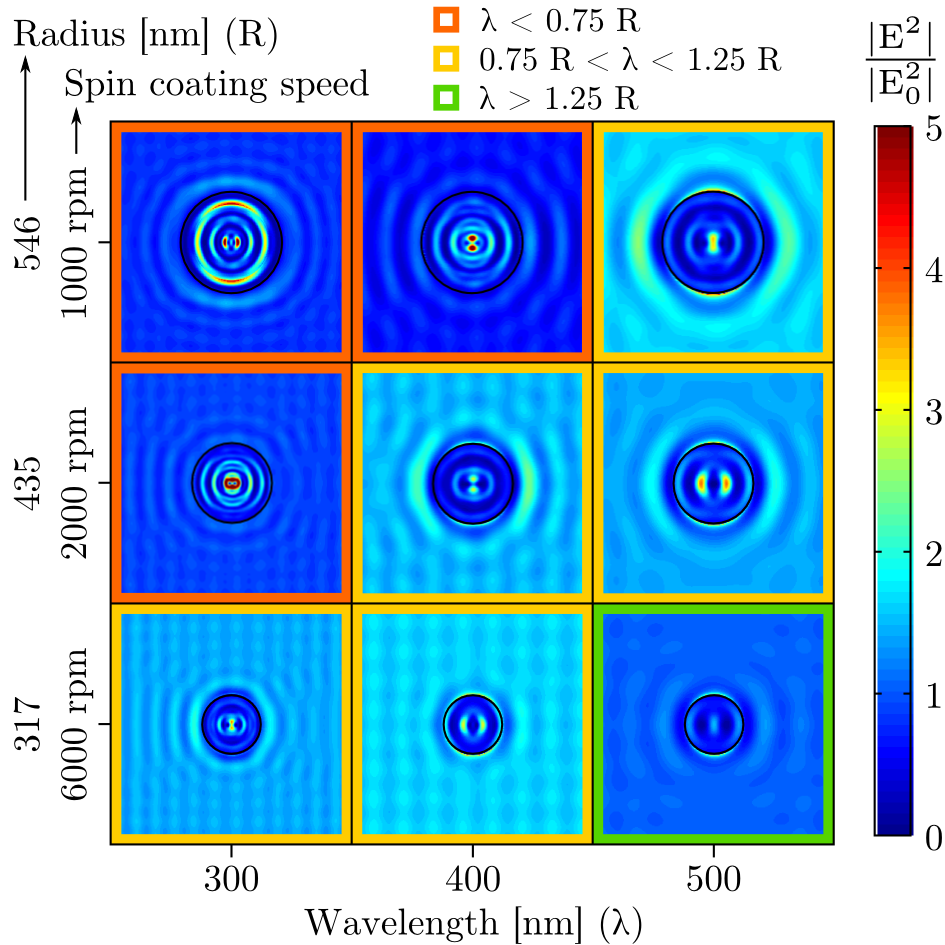
In order to explain the origin of this shift we performed a series of near-field simulations of the electric field distribution as a function of the microspheroid size and light wavelength (Figure 6). In these simulations only one spheroid is considered, with a radius determined by the mean radius obtained experimentally for three different spin coating speeds. Two photonic regimes are observed as a function of the relationship between the spheroid dimensions and the incoming light wavelength. In the first regime, light wavelength is smaller than the spheroid radius and strong resonant modes are observed while near-field scattering is weak. In the second regime, light wavelength is equivalent to the spheroid radius, the resonant modes intensity is decreased while the scattered field intensity increases. This explains why light confinement is shifting from mWO3 to hematite when decreasing the spheroid sizes. When spheroids sizes are decreased, the confined modes intensities are decreased inside the spheroids while light is scattered more efficiently and concentrated between and at the surface of the spheroids.
In the present study, a self-organization strategy was successfully implemented as an inexpensive and upscalable route for production of mWO3 films composed of spheroids that were further coated with a hematite ultra-thin film. The spheroids size distribution can be easily tuned in the micrometric to submicrometric range by changing a simple process step, the spin coating speed.
A comprehensive analysis of the charging effects in the hematite ultra-thin film overlay was also conducted. A good compromise between light absorption and charge carrier collection was obtained by correlating the hematite film thickness to its charging behavior. Samples were prepared with a 5 nm ultra-thin hematite film overlay on the mWO3 films composed of pillars with different size distributions. A significant contribution of hematite to the photocurrent was observed when coated on the light trapping mWO3 spheroids whereas no photocurrent could be measured with the same hematite ultra-thin film coated on bare FTO glass.
Tuning the pillar sizes allowed an in depth study of the impact of the light/microstructure interaction on the overall photoanode photocurrent. Simulation of the photonic effects inside the microstructure, using an oblate coated spheroids modelization, quantitatively matched experimental results and allowed to calculate the power absorbed by each oxide. The variations in simulated power absorbed showed a strong correlation with the photocurrent. The light trapping effects inside the spheroids have therefore a strong influence on hematite and mWO3 photoactivities, with photocurrent values ranging from single to double depending on the spheroid sizes. It is worth noting that the variations in simulated power absorbed / photoactivity is decreasing in mWO3, whereas it is increasing in hematite when the spheroid sizes is decreasing. Light is concentrated toward the surface of the spheroids when the spheroids size is decreasing, a compromise therefore needs to be achieved using spheroid sizes in the middle of the screened dimensions range (spin coating speed: 2500-3000 rpm, spheroid height ≈ 250 nm and diameter ≈ 750 nm).
Taking advantage of the same self-organization technique, a possible outlook of this study would be the implementation of more complex microstructures. The present study was focused on a monolayer of mWO3 spheroids but multiple vesicle layers can be coated on the substrate. Preliminary results already show that it is possible to obtain such mWO3 films with micrometric light scattering centers displayed on multiple layers. This would allow to take advantage of more photonic effects, such as near field focusing that is another photonic feature of oblate spheroids30, and also an increase of the photoanode surface and thickness.
Photoanodes preparation: The films preparation consists of four steps, depicted in Figure 1. The first step of the process consists in preparing the polymer vesicles which are enclosing ammonium tungstate aqueous solution, Figure 1 a. To achieve this step, 0.5M of tungstic acid (H2WO4) is dissolved in a 5M ammonium hydroxide aqueous solution. Upon mixing, the insoluble tungstic acid reacts with ammonium ions to produce ammonium tungstate, which is soluble in water. The amount of tungstic acid used in this preparation leads to a saturated aqueous solution of ammonium tungstate. After one hour stirring of this solution, 0.5M in sulfuric group of poly(4-styrenesulfonic acid) (PSS) is added. Then the solution is further mixed during 10 hours. All chemicals in this process: tungstic acid, ammonium hydroxide and PSS were purchased from Sigma Aldrich. After vesicle formation, the suspension is spin coated on fluorinated tin-oxide coated aluminoborosilicate glass, 10 Ω/sq from Solaronix (Figure 1 b.). Different spin coating speeds are applied, ranging from 1000 rpm to 6000 rpm. The other spin coating parameters are kept constant, the holding speed is reached within 2 seconds and the holding time is 60 seconds. The spin coater used in this study is a Primus STT15 from ATMgroup. After spin coating the films are pyrolysed at 500°C for 2 hours and result in a tungsten oxide layer constituted of micrometric spheroids, sintered on the FTO surface (Figure 1 c.). The last step of the thin film preparation is the deposition of a hematite thin film overlay (Figure 1 d.). This thin film is obtained by spin coating Fe(NO3)3, dissolved in ethanol, at 6000 rpm for 60 seconds (holding speed reached within 2 seconds). By tuning the Fe(NO3)3 concentration between 0.0125M and 0.5M, hematite thin films with thicknesses ranging from a few nanometers to 30 nm have been obtained.
Photoelectrochemistry: The photoelectrochemical measurements were performed with a Voltalab PGZ402 potentiostat from Radiometer Analytical using a three electrode setup. The measurement were carried under AM 1.5 illumination from a Lot-Oriel solar simulator. The electrolyte used in this study was a 0.05M phosphate buffered saline solution (PBS).
FDTD calculations: A commercial-grade simulator based on the finite-difference time-domain method was used to perform the calculations29. One model was created for each spin coating speed. Each model involves 67 oblate coated spheroids with a diameter distribution derived from image processing on SEM images. The mean distance and height of the spheroids was obtained by image processing on SEM images and AFM scans respectively. The spheroids were displayed to form a periodic triangular array respecting the experimental mean spheroid distance. Perfectly matched layers, parallel to the modeled film surface, were used before and after the film. The refractive index of the medium was given a value of 1.33 (water), the refractive index for mWO3 was obtained from Hutchins et al.19 and the refractive index for hematite was obtained from the University of Waterloo online database31.
This research received financial support from the Swiss National Science Foundation projects 137868 (Reaction-diffusion processes for the growth of patterned structures and architectures: a bottom-up approach for photoelectrochemical electrodes), and R’Equip 121306 (Fundamental Aspects of Photocatalysis and Photoelectrochemistry / Basic Research Instrumentation for Functional Characterization). The Helmholtz Zentrum Berlin is acknowledged for granting synchrotron beamtime (application 120735) and the authors would like to thank Dr Peter Guttmann for its technical support during beamtime.
[1] Diane K. Zhong, Maurin Cornuz, Kevin Sivula, Michael Graetzel, and Daniel R. Gamelin. Photo-assisted electrodeposition of cobalt-phosphate (co-pi) catalyst on hematite photoanodes for solar water oxidation. Energy & Environmental Science, 4(5):1759–1764, May 2011. doi:10.1039/c1ee01034d.
[2] Renata Solarska, Rafal Jurczakowski, and Jan Augustynski. A highly stable, efficient visible-light driven water photoelectrolysis system using a nanocrystalline wo3 photoanode and a methane sulfonic acid electrolyte. Nanoscale, 4(5):1553–1556, 2012. doi:10.1039/c2nr11573e.
[3] Aiming Mao, Jung Kyu Kim, Kahee Shin, Dong Hwan Wang, Pill J. Yoo, Gui Young Han, and Jong Hyeok Park. Hematite modified tungsten trioxide nanoparticle photoanode for solar water oxidation. Journal of Power Sources, 210:32–37, July 2012. doi:10.1016/j.jpowsour.2012.02.112.
[4] Heli Wang, Todd Deutsch, and John A. Turner. Direct water splitting under visible light with nanostructured hematite and wo3 photoanodes and a gainp2 photocathode. Journal of the Electrochemical Society, 155(5):F91–F96, 2008. doi:10.1149/1.2888477.
[5] Coleman X. Kronawitter, Lionel Vayssieres, Shaohua Shen, Leijin Guo, Damon A. Wheeler, Jin Z. Zhang, Bonnie R. Antoun, and Samuel S. Mao. A perspective on solar-driven water splitting with all-oxide hetero-nanostructures. Energy & Environmental Science, 4(10):3889–3899, October 2011. doi:10.1039/c1ee02186a.
[6] Kevin Sivula, Florian Le Formal, and Michael Graetzel. Wo3-fe2o3 photoanodes for water splitting: A host scaffold, guest absorber approach. Chemistry of Materials, 21(13):2862–2867, July 2009. doi:10.1021/cm900565a.
[7] J. H. Kennedy and K. W. Frese. Photo-oxidation of water at alpha-fe2o3 electrodes. Journal of the Electrochemical Society, 125(5):709–714, 1978. doi:10.1149/1.2131532.
[8] Florian Le Formal, Kevin Sivula, and Michael Graetzel. The transient photocurrent and photovoltage behavior of a hematite photoanode under working conditions and the influence of surface treatments. Journal of Physical Chemistry C, 116(51):26707–26720, December 2012. doi:10.1021/jp308591k.
[9] L. A. Marusak, R. Messier, and W. B. White. Optical-absorption spectrum of hematite, alpha-fe2o3 near ir to uv. Journal of Physics and Chemistry of Solids, 41(9):981–984, 1980. doi:10.1016/0022-3697(80)90105-5.
[10] Florian Le Formal, Michael Graetzel, and Kevin Sivula. Controlling photoactivity in ultrathin hematite films for solar water-splitting. Advanced Functional Materials, 20(7):1099–1107, April 2010. doi:10.1002/adfm.200902060.
[11] Ilkay Cesar, Kevin Sivula, Andreas Kay, Radek Zboril, and Michael Graetzel. Influence of feature size, film thickness, and silicon doping on the performance of nanostructured hematite photoanodes for solar water splitting. Journal of Physical Chemistry C, 113(2):772–782, January 2009. doi:10.1021/jp809060p.
[12] Yelin Hu, Debajeet K. Bora, Florent Boudoire, Florian Haussler, Michael Graetzel, Edwin C. Constable, and Artur Braun. A dip coating process for large area silicon-doped high performance hematite photoanodes. Journal of Renewable and Sustainable Energy, 5(4):043109, 2013. doi:10.1063/1.4812831.
[13] Zhaosheng Li, Wenjun Luo, Minglong Zhang, Jianyong Feng, and Zhigang Zou. Photoelectrochemical cells for solar hydrogen production: current state of promising photoelectrodes, methods to improve their properties, and outlook. Energy & Environmental Science, 6(2):347–370, February 2013. doi:10.1039/c2ee22618a.
[14] Hen Dotan, Ofer Kfir, Elad Sharlin, Oshri Blank, Moran Gross, Irina Dumchin, Guy Ankonina, and Avner Rothschild. Resonant light trapping in ultrathin films for water splitting. Nature Materials, 12(2):158–164, February 2013. doi:10.1038/NMAT3477.
[15] Hanwei Gao, Chong Liu, Hoon Eui Jeong, and Peidong Yang. Plasmon-enhanced photocatalytic activity of iron oxide on gold nanopillars. Acs Nano, 6(1):234–240, January 2012. doi:10.1021/nn203457a.
[16] Jonathan Grandidier, Raymond A. Weitekamp, Michael G. Deceglie, Dennis M. Callahan, Corsin Battaglia, Colton R. Bukowsky, Christophe Ballif, Robert H. Grubbs, and Harry A. Atwater. Solar cell efficiency enhancement via light trapping in printable resonant dielectric nanosphere arrays. Physica Status Solidi A-applications and Materials Science, 210(2):255–260, February 2013. doi:10.1002/pssa.201228690.
[17] Jonathan Grandidier, Dennis M. Callahan, Jeremy N. Munday, and Harry A. Atwater. Light absorption enhancement in thin-film solar cells using whispering gallery modes in dielectric nanospheres. Advanced Materials, 23(10):1272–+, March 2011. doi:10.1002/adma.201004393.
[18] Y. N. Xia, B. Gates, Y. D. Yin, and Y. Lu. Monodispersed colloidal spheres: Old materials with new applications. Advanced Materials, 12(10):693–713, 2000. doi:10.1002/(SICI)1521-4095(200005)12:10<693.
[19] M. G. Hutchins, O. Abu-Alkhair, M. M. El-Nahass, and K. A. El-Hady. Structural and optical characterisation of thermally evaporated tungsten trioxide (wo3) thin films. Materials Chemistry and Physics, 98(2-3):401–405, August 2006. doi:10.1016/j.matchemphys.2005.09.052.
[20] C. Boissiere, A. van der Lee, A. El Mansouri, A. Larbot, and E. Prouzet. A double step synthesis of mesoporous micrometric spherical msu-x silica particles. Chemical Communications, (20):2047–2048, October 1999. doi:10.1039/a906509a.
[21] B. Lefevre, A. Galarneau, J. Iapichella, C. Petitto, F. Di Renzo, F. Fajula, Z. Bayram-Hahn, R. Skudas, and K. Unger. Synthesis of large-pore mesostructured micelle-templated silicas as discrete spheres. Chemistry of Materials, 17(3):601–607, February 2005. doi:10.1021/cm048481z.
[22] Fei Teng, Wenqing Yao, Yongfa Zhu, Guizhi Gao, and Dennis Desheng Meng. Micelle-assisted hydrothermal synthesis of the uniform co3o4 nanorods and its chemoluminescence properties of co oxidation. Journal of Non-crystalline Solids, 355(48-49):2375–2380, November 2009. doi:10.1016/j.jnoncrysol.2009.08.011.
[23] Meihua Yu, Liang Zhou, Jun Zhang, Pei Yuan, Peter Thorn, Wenyi Gu, and Chengzhong Yu. A simple approach to prepare monodisperse mesoporous silica nanospheres with adjustable sizes. Journal of Colloid and Interface Science, 376:67–75, June 2012. doi:10.1016/j.jcis.2012.03.014.
[24] K. Basavaiah and A. V. Prasada Rao. Synthesis of polystyrenesulfonic stabilized magnetite nanoparticles. Chemical Science Transactions, 2:382–386, 2012. doi:10.7598/cst2012.4790.
[25] S. Török, J. Osán, B. Beckhoff, and G. Ulm. Ultratrace speciation of nitrogen compounds in aerosols collected on silicon wafer surfaces by means of txrf-nexafs. Powder Diffraction, 19:81–86, February 2004. ISSN 1945-7413. doi:10.1154/1.1649327.
[26] Adam W. Gillespie, Fran L. Walley, Richard E. Farrell, Tom Z. Regier, and Robert I. R. Blyth. Calibration method at the N K-edge using interstitial nitrogen gas in solid-state nitrogen-containing inorganic compounds. Journal of Synchrotron Radiation, 15(5):532–534, Sep 2008. doi:10.1107/S0909049508014283.
[27] C. Sanchez, K. D. Sieber, and G. A. Somorajai. The photoelectrochemistry of niobium doped alpha-fe2(03). Journal of Electroanalytical Chemistry, 252(2):269–290, October 1988. doi:10.1016/0022-0728(88)80216-X.
[28] S. M. Wilhelm, K. S. Yun, L. W. Ballenger, and N. Hackermann. Semiconductor properties of iron-oxide electrodes. Journal of the Electrochemical Society, 126(3):419–424, 1979. doi:10.1149/1.2129055.
[29] Lumerical Solutions, Inc. URL http://www.lumerical.com/tcad-products/fdtd/.
[30] Manuel J. Mendes, Ignacio Tobias, Antonio Marti, and Antonio Luque. Light concentration in the near-field of dielectric spheroidal particles with mesoscopic sizes. Optics Express, 19(17):16207–16222, August 2011. doi:10.1364/OE.19.016207.
[31] Natural Phenomena Simulation Group, University of Waterloo. URL http://www.npsg.uwaterloo.ca/data/sand.php.